


At an A&E firm, payroll is usually the biggest line item on the books. And every hour your team spends on work that a client isn't paying for is an hour that costs you money without bringing any in.
Capacity utilization is the metric that helps A& firms keep track of this, telling you how much of your team's available time is going toward billable client work, and how much is sitting idle.
It’s not difficult to calculate, but there are a couple of things you need to get right before you can put it into practice.
In this guide, we’ll show you how to calculate the capacity utilization rate, benchmark it against healthy ranges, and act on what the number tells you.

What is Capacity Utilization for an A&E Firm?
Capacity utilization is the percentage of a firm's available working hours that are spent on billable client work.
In an A&E firm specifically, "output" is billable hours rather than physical units (as is the case in manufacturing), meaning the formula looks like this:
Capacity utilization % = (Billable hours ÷ Available hours) × 100
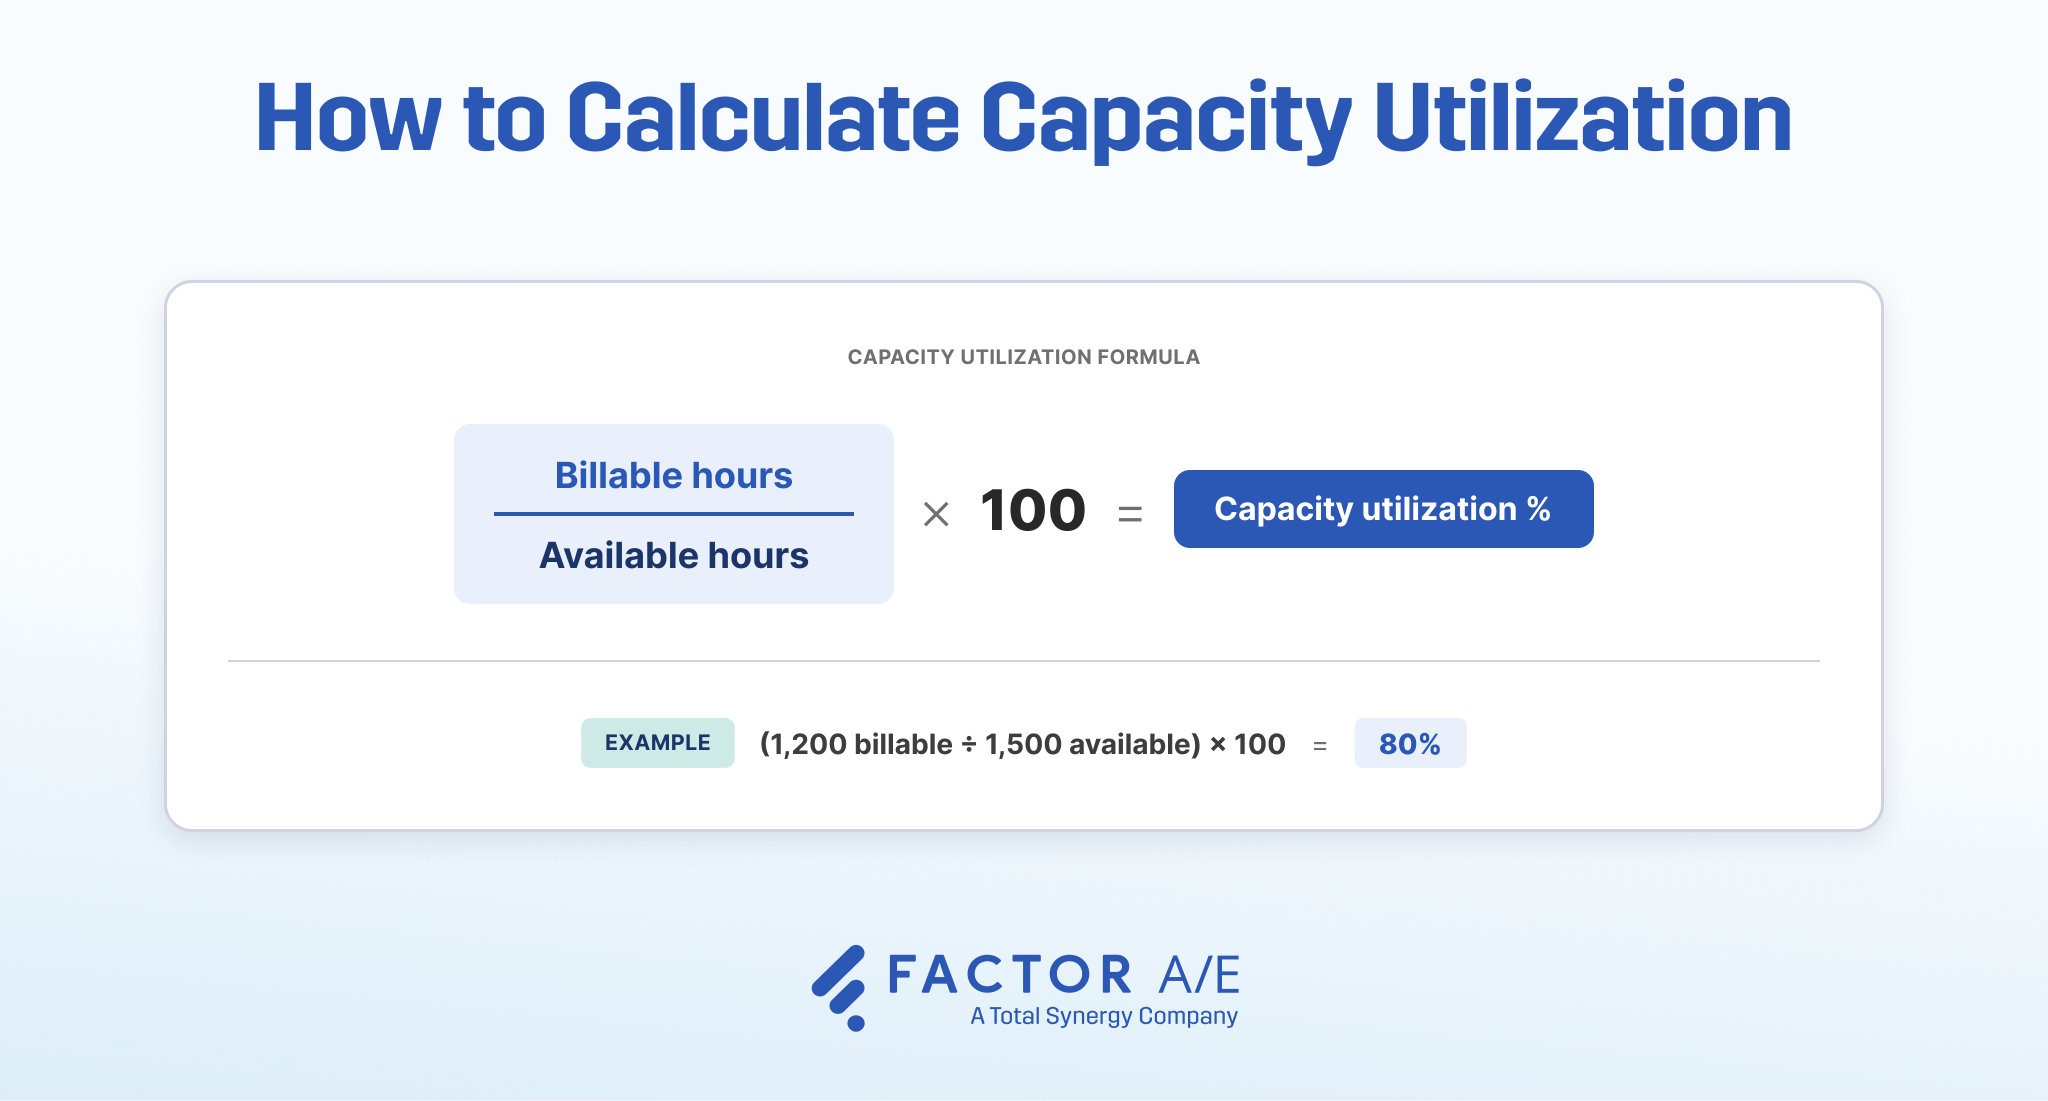
Say, for example, that your firm has 1,500 available hours in a month, and 1,200 of them are billable (time that a client pays for, such as hours spent on design work). You’d have a capacity utilization rate of 80%.
Why Capacity Utilization Matters for A&E Firms
Labor is an A&E firm’s highest cost, which means the more you’re able to utilize that expense, the more profitable your business will be.
It's not just about endlessly increasing the number, however. Idle salaried time drains cash, but overloaded time erodes quality and morale, so finding the right balance is critical.
Capacity utilization rates can also drive concrete business decisions, like when to hire, when to chase work, when to outsource.
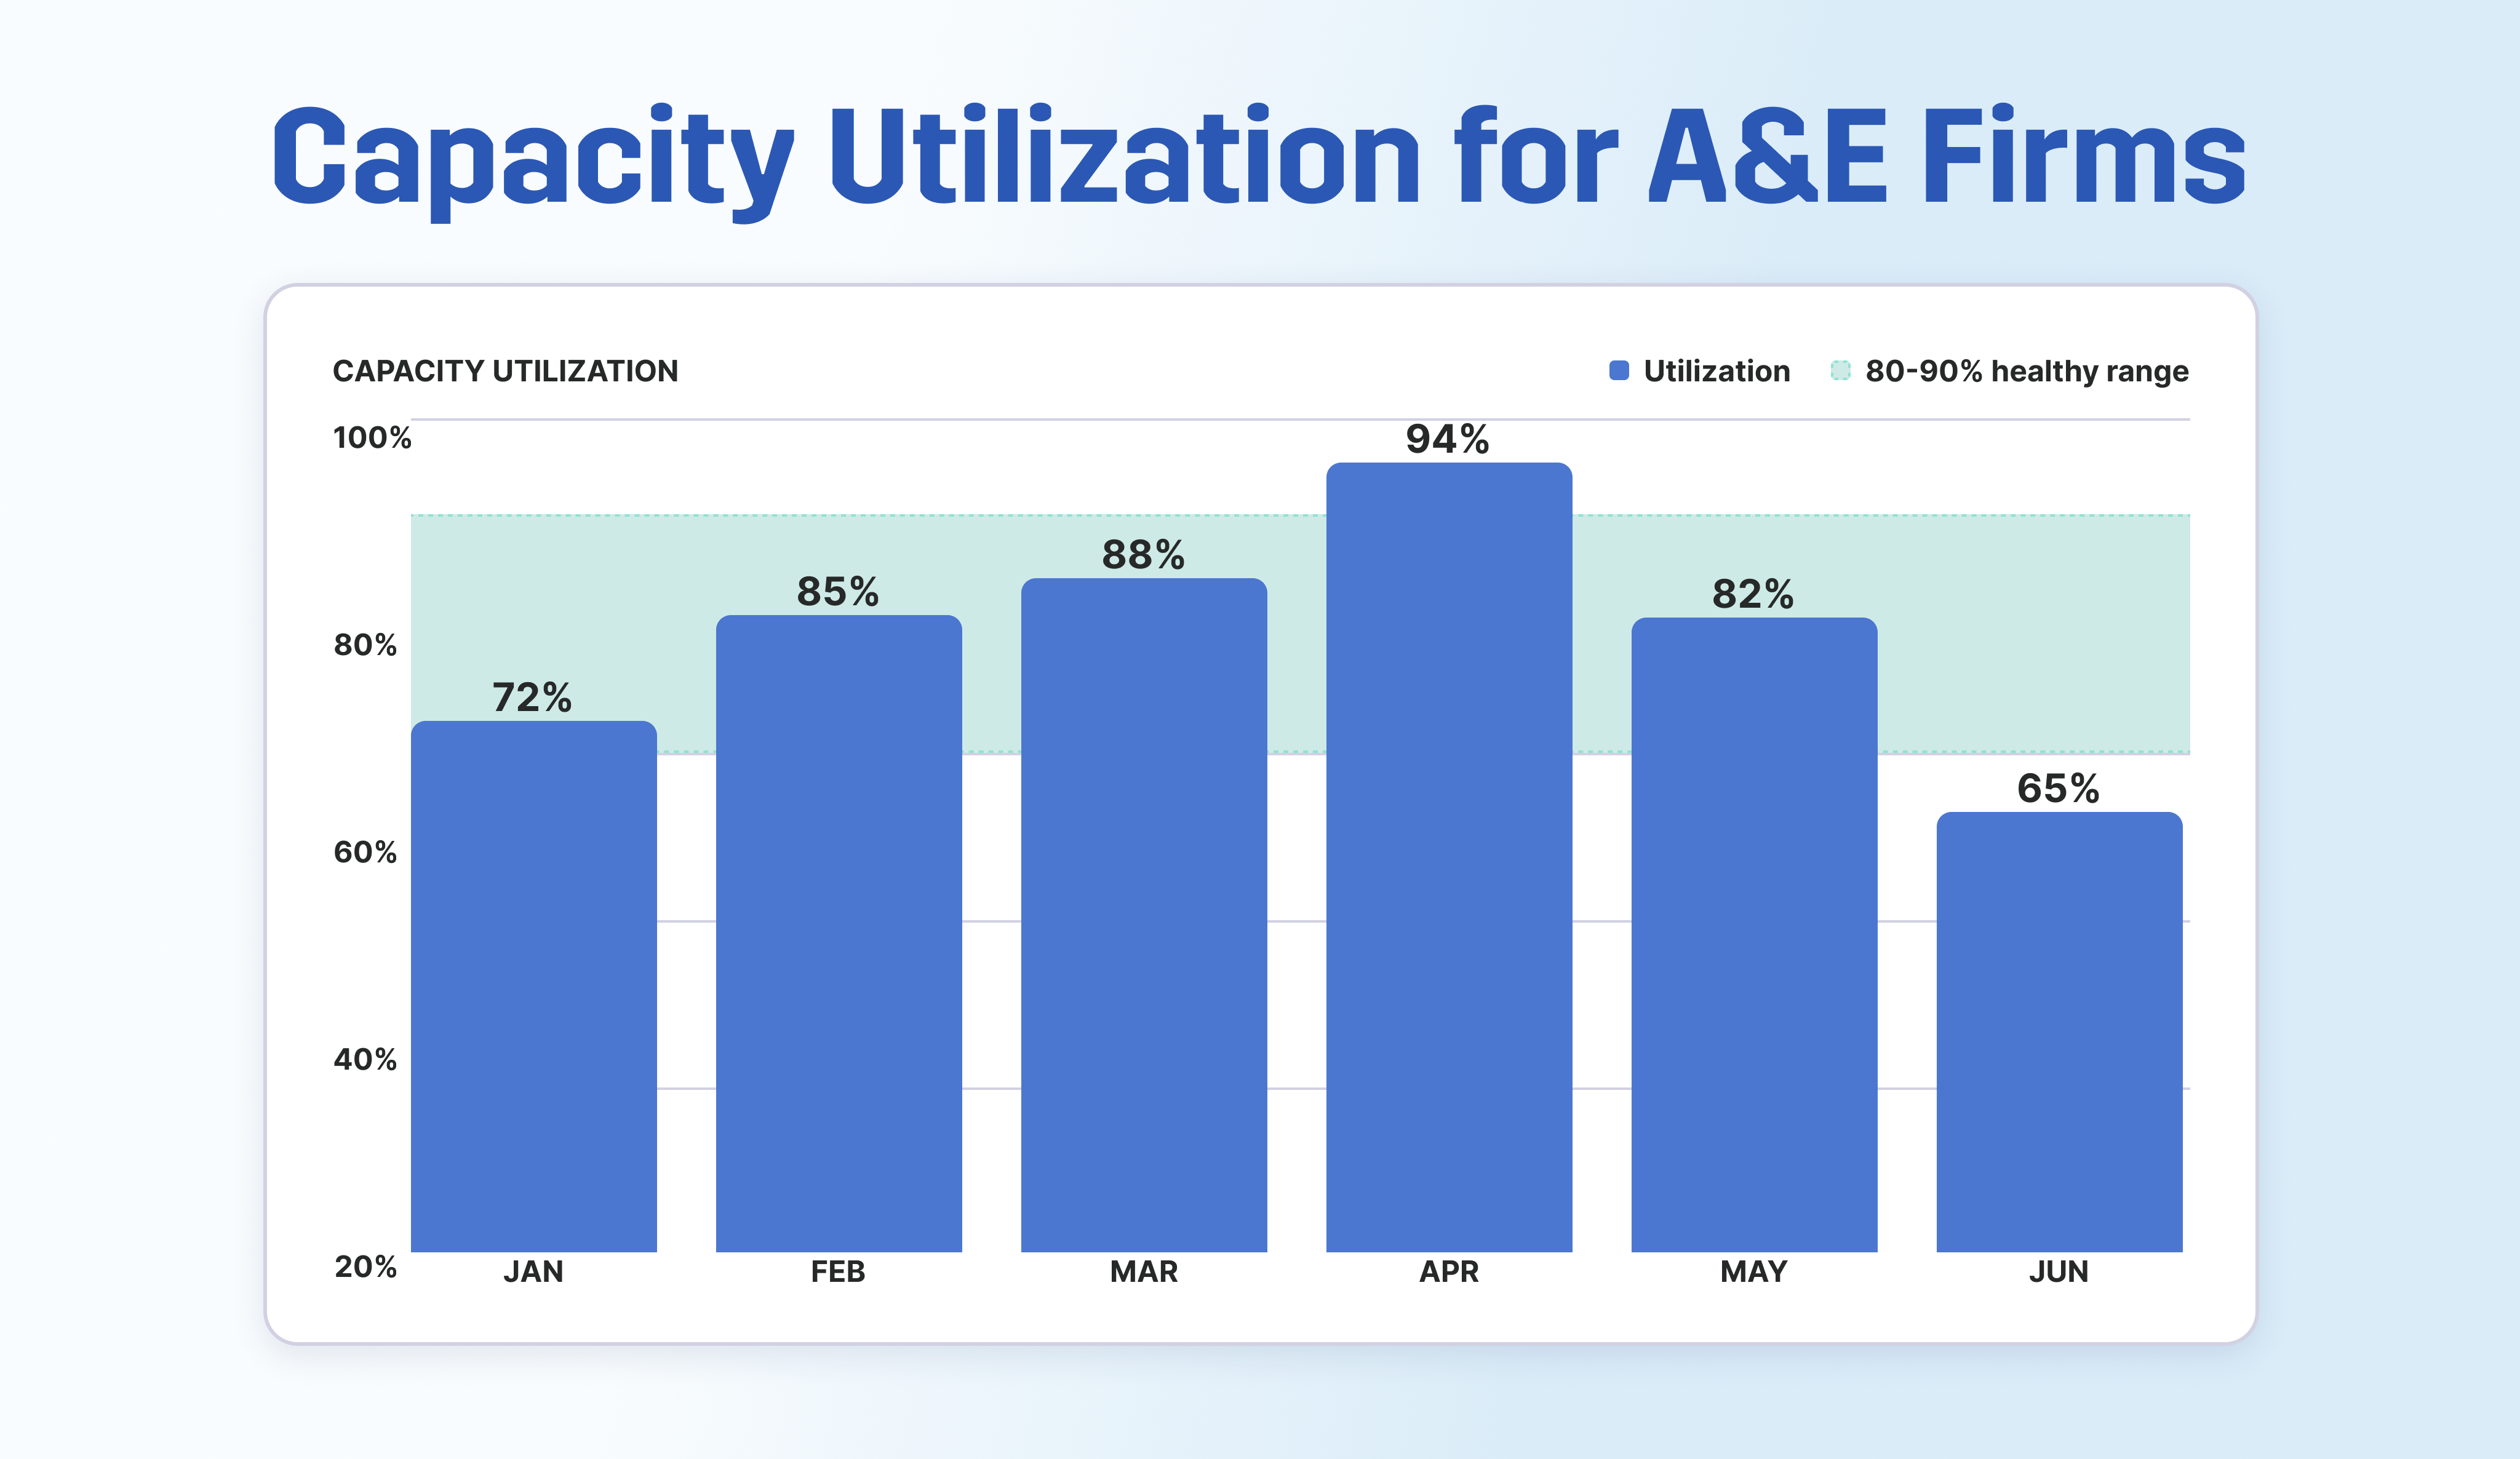
Say your firm runs at 94% for three months straight. That tells you the team is absorbing every hour of work coming in with nothing left over, so the moment a rush job or a revision cycle lands, something has to give, whether that's a deadline, quality, or someone's weekend. A sustained rate that high is the signal to hire or bring in outside help before the strain shows up in the work.
What's a Healthy Capacity Utilization Rate?
Ultimately, a healthy capacity utilization rate depends on a few factors, such as role and firm size (we’ll cover role-by-role benchmarks later in the piece).
In general, though, the healthy band for A&E firms is between 80% and 90%. In our 2026 Architecture & Engineering Industry Benchmark Report, 58% of firms reported utilization rates of 71% or higher, to give you an idea of what real firms are achieving.
The point is that 100% utilization is not the goal. It leaves no buffer for revisions, QA, coordination, PTO, or winning new work, and sustained utilization above 90% typically leads to burnout, mistakes, and quality problems.
Because capacity utilization ties so directly to profitability, the rate is worth watching as it moves rather than reconstructing it from timesheets after the quarter closes. By then, low capacity utilization has already cost you.
Factor's firm-wide dashboard, The Pulse, keeps utilization in front of you in real time, so a slide toward idle capacity or a climb into overload shows up while there's still room to act on it.
The Two Inputs You Need to Get Right to Calculate Capacity Utilization Properly
The formula for calculating capacity utilization is simple, but the result can be inaccurate or just unhelpful if you don’t define and measure the two inputs correctly.
Here’s how you want to define billable and available hours in your firm.
Billable Hours (What Counts and What Doesn't)
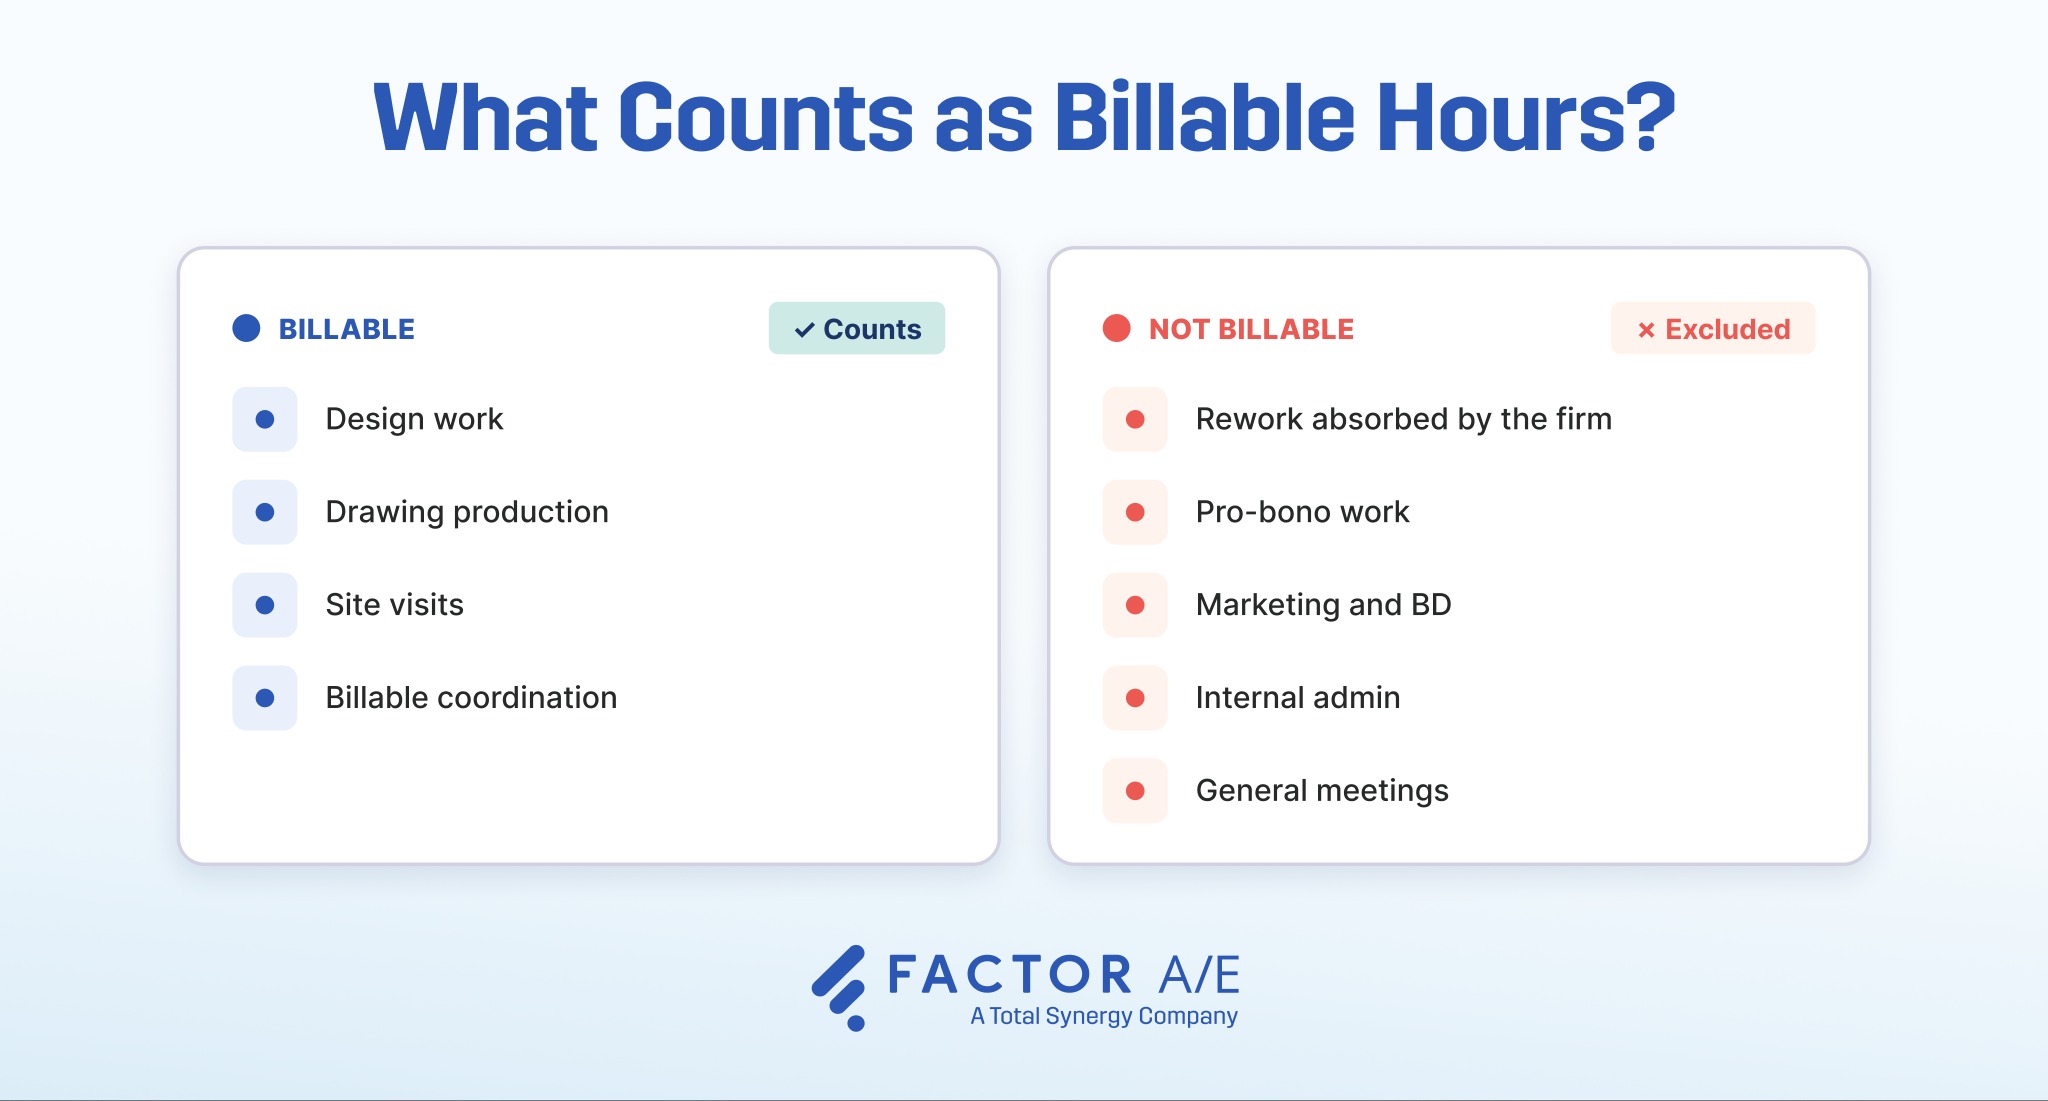
Billable hours cover time a client pays for, such as design work, drawing production, site visits, and billable coordination and project management work.
Excluded from the billable hours figure should be:
- Rework absorbed by the firm
- Pro bono work
- Marketing and internal admin time
- General meetings that aren’t billable (like a weekly all-hands)
A common error here is to fold overhead or admin meetings into billable time, which inflates the rate and masks cash-flow risk.
Take an architect who logs 40 hours in a week: 32 on drawings and site coordination, and 8 split between an internal team meeting and a marketing catch-up. Counted correctly, that's 32 billable hours against a 40-hour week, or 80% billable. If you fold the 8 non-billable hours into the billable total, and you're reporting 40, it reads as 100% billable when the real figure is 80%.
The inflated number hides the cost of that idle time and masks the cash-flow risk underneath it.
Worse, it steers you wrong: an architect who looks fully billable seems fine to give more work to, when in reality, a fifth of the week is already going somewhere else.
Available Hours (Subtracting PTO, Holidays, Admin, BD, and Training)
Available hours are not the same as total hours. You don’t just take your total headcount and multiply it by 40 hours a week, because it's not realistic for people to actually work 40 hours a week every week.
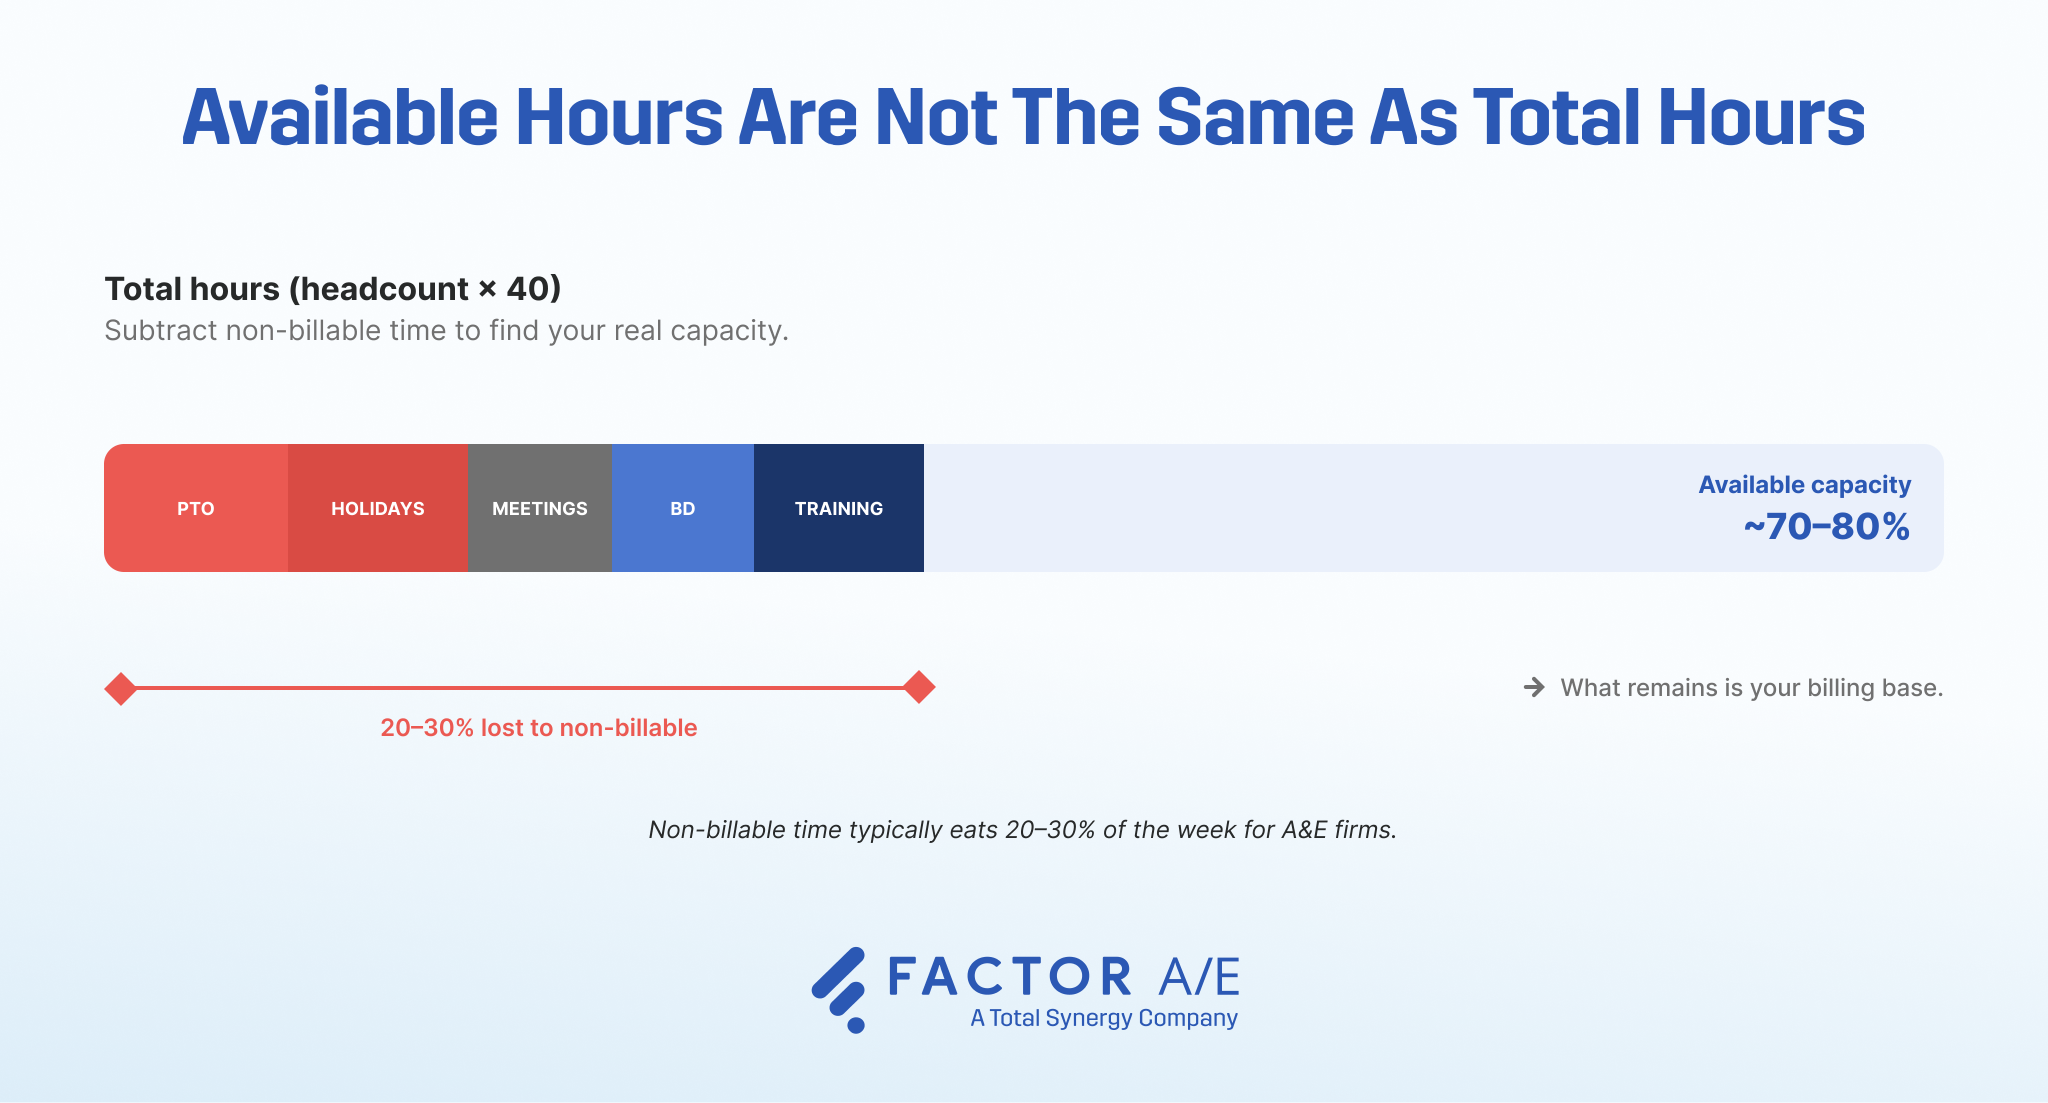
Instead, you need to subtract paid time off, holidays, sick time, and statutory non-working time, as well as predictable non-billable load like:
- Business development
- QA and training time
- R&D work
This non-billable work typically consumes around 20-30% of a professional’s week, which means the typical 40-hour work week actually only has around 30 available hours in it.
By trimming total hours down to real available hours, you get a measurement of realistic capacity, which provides the right denominator for the capacity utilization formula.
It's important to note, though, that both of these figures, billable hours and real available hours, can be a chore to assemble by hand.
Doing it manually means pulling billable time from one system, then cross-referencing PTO, holidays, and recurring non-billable commitments from calendars and spreadsheets to work out what each person's real available hours were. Do that across a whole firm, every week, and it eats real time.
When billable time and resource schedules live in one project management system, both numbers are already there, and the rate is calculated automatically instead of you having to build it from scratch each cycle.
How to Calculate Capacity Utilization: Step by Step
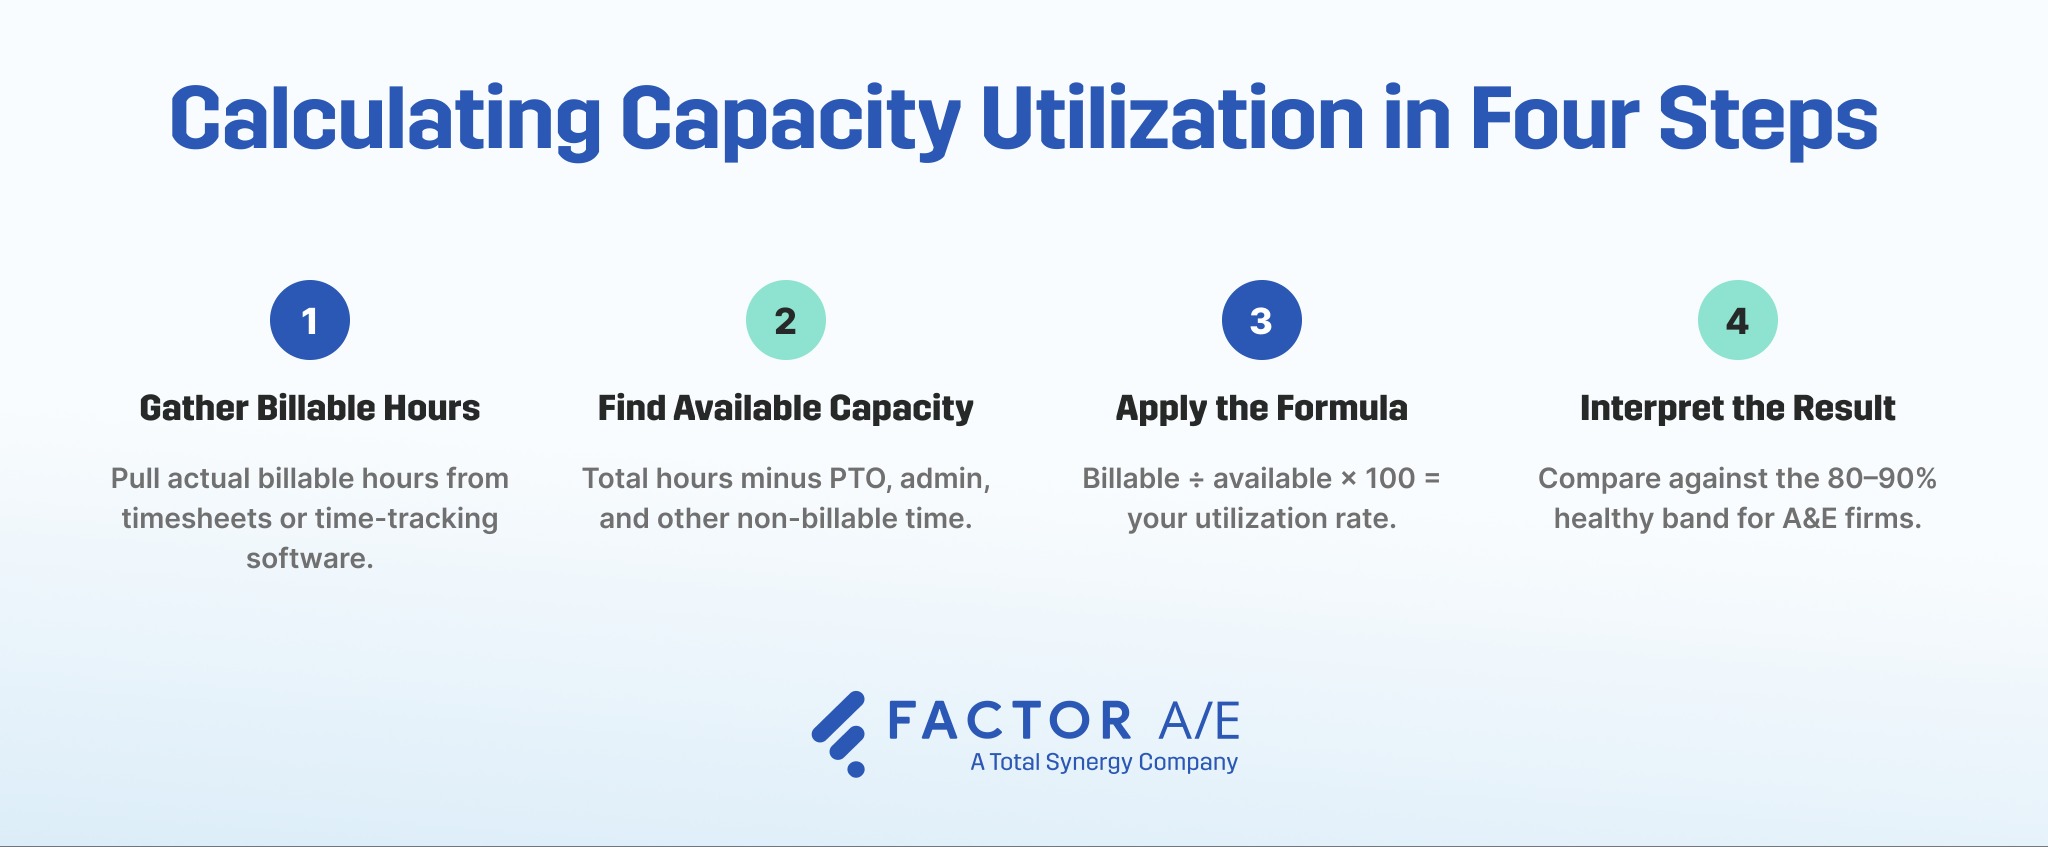
1. Gather your actual billable hours
First, pull your firm’s billable hours for a defined period (week, month, quarter) from timesheets or your time-tracking system.
Make sure you use a consistent time window across all data sources so comparisons hold, and don’t forget to strip out rework, pro bono, and marketing before totaling.
2. Determine available (maximum) capacity
Next, you need to work out the available capacity.
Start by multiplying headcount by standard hours for the period (40 for a week, for example), then subtract PTO, holidays, and predictable non-billable time to reach effective capacity.
3. Apply the formula
Here’s where you apply the actual formula, dividing billable hours by available hours.
For instance, if you have 1,200 billable hours and 1,500 available hours for the period:
1,200 / 1,500 = 80% capacity utilization
4. Interpret the result
You don’t just calculate capacity utilization and leave it there. Instead, you interpret the result, determine if it tracks against expectations, and put strategies in place in case it doesn’t.
80-90% is usually a healthy range to be in for most A&E firms. Below that, you’re underutilizing your labor capacity. Above it, and you’re risking team overload and burnout.
Capacity utilization doesn’t take a lot of difficult math to calculate, but it is still burned time working it out each week, especially if you’re starting from scratch on the billable hours figures. Factor’s A&E project management software removes that manual numberwork, supporting automated calculation and real-time tracking of utilization rates.

How to Read and Act on Your Capacity Utilization Rate
Your capacity utilization rate, and especially how it moves over time, tells you a lot about the health of your firm:
- Below 70%: Idle capacity draining cash. Chase work, accelerate proposals, reassign, or reduce hours.
- 70–85%: Healthy. Monitor the trend weekly for drift.
- 85–90%: Strong but tight. Protect quality and staff wellbeing, guard scope.
- Above 90%: Sustainable only short-term. Find bottlenecks, push back on low-value work, hire or outsource.
The point isn’t just to track the number; it's to look at what’s beneath. For example, 44% of firms say project management tasks are the #1 thing pulling their teams away from design, with 38% mentioning client communication and approvals as the second biggest time drain.
Knowing what's at the core of why capacity utilization isn’t where it needs to be tells you where to focus your efforts to fix it.
Capacity utilization benchmarks by role
No single target utilization rate fits every position in the firm. Benchmarks differ by role because of how much time each spends on billable production vs. business development.
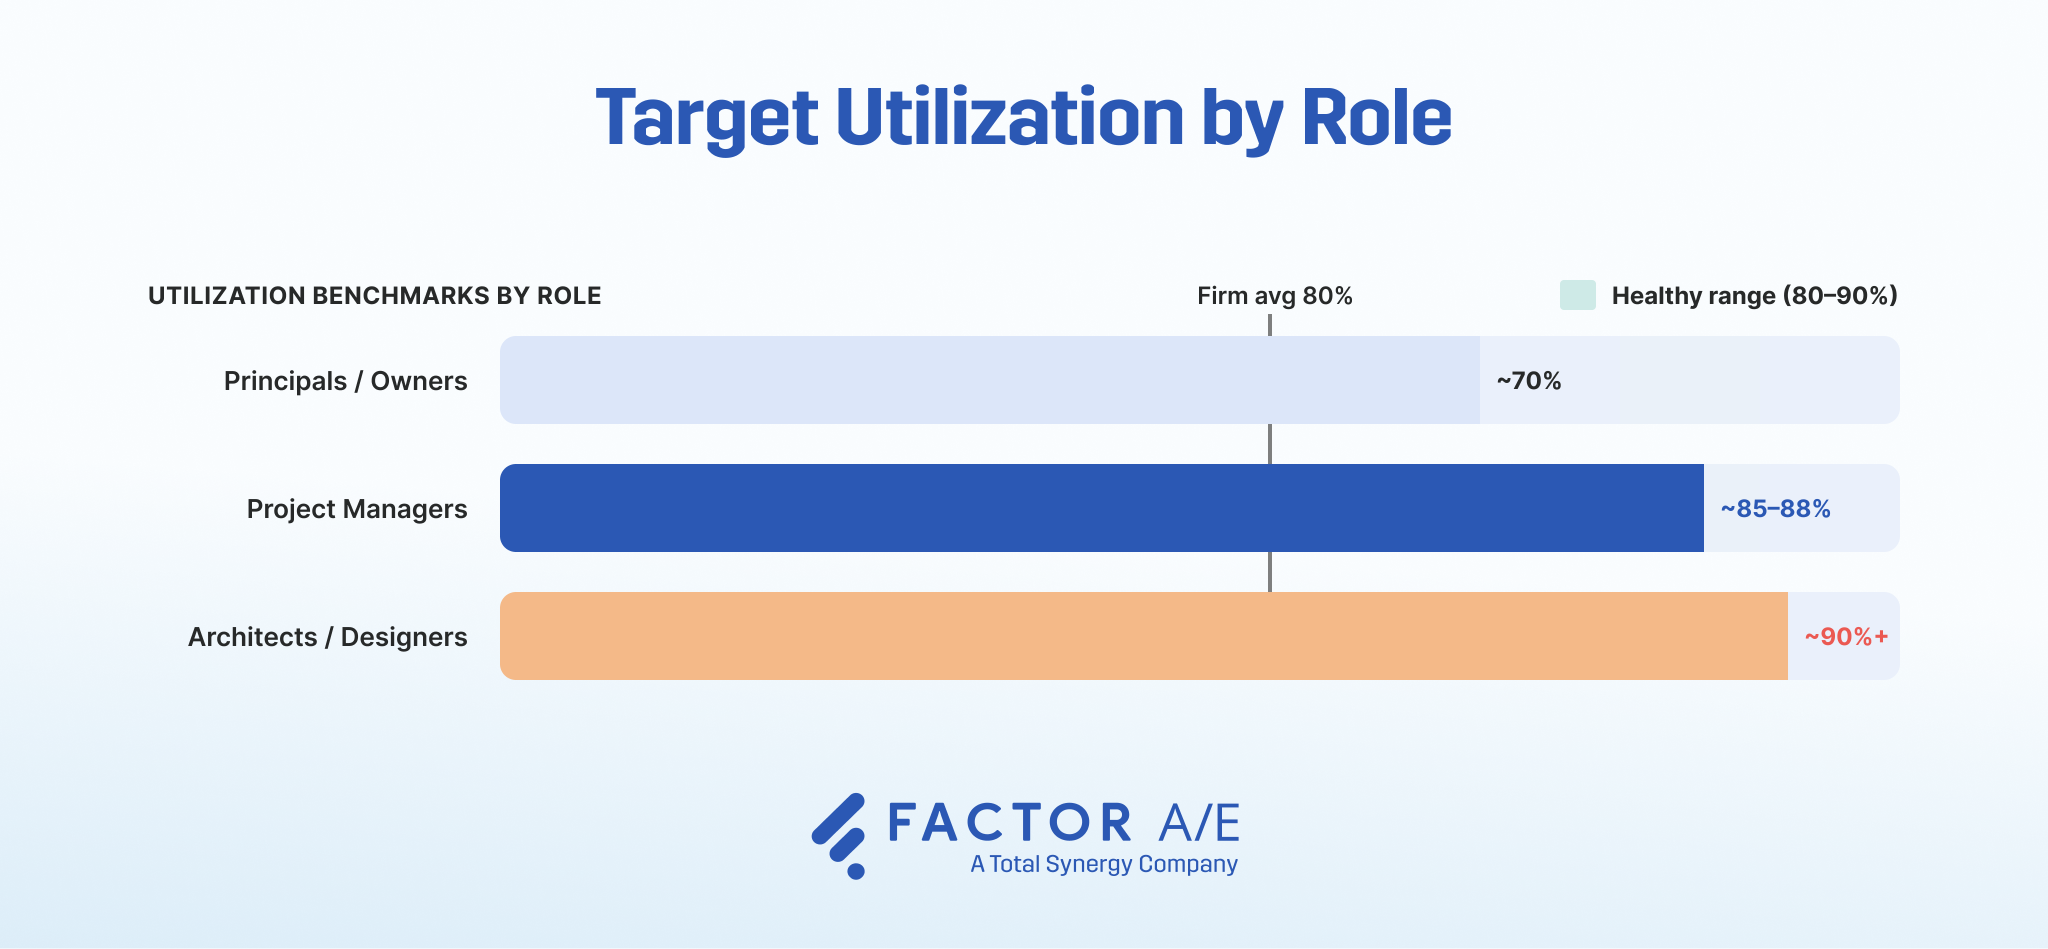
Role-based targets to aim for include:
- Principals and Owners: Lower target (~70%), because BD, management, and firm operations consume billable time.
- Project Managers: Mid-to-high target (~85–88%), balancing production with coordination and oversight.
- Project Architects and Designers: Highest target (~90%+), since these are primarily production roles.
Capacity Utilization Examples for A&E Firms
The clearest way to see how capacity utilization works is to run the numbers at a few different levels, starting with one person and building up to the whole firm.
Take a single architect first. After PTO and admin come out, they have 150 available hours in a month and log 130 billable hours against them. That works out to 130 ÷ 150, or 87%.
Scale it up to a small team, and the method is the same, just summed. A five-engineer project team logs 160 billable hours against 200 available, which comes to 160 ÷ 200, or 80%.
Roll the math up across every role, though, and a single firm-wide figure is where the number can be a little misleading.
A firm might post a healthy 80% overall while its designers sit at 95% and drown, and its principals sit at 60% with room to spare. The blended average looks fine, but there are actually two opposite problems hiding within it.
That's exactly why the role-by-role view matters. The firm-wide rate tells you the firm is healthy on average, but not that any given seat is.
Capacity Utilization vs. Related Metrics
Capacity utilization is often confused with a couple of related terms that are worth knowing about.
Capacity utilization vs. realization rate
Utilization tells you how much available time was billable, while realization rate tells you how much of billed/billable value you actually collected (billed vs. worked, or collected vs. billed).
Any difference between the two arises from billing habits. A firm can be highly utilized but poorly realized if it writes down hours or discounts invoices regularly.
Capacity utilization vs. employee utilization
Employee or individual utilization is one person's billable percentage, while capacity utilization is typically used for the firm-wide (or team) view of productive output against maximum potential.
Both are important for business decision-making, since individual figures roll up into the firm-wide rate.
Turning Capacity Utilization Into a Real-Time Metric
Capacity utilization is a simple number, but it carries a lot of weight.
It ties your firm's biggest expense directly to its profitability, flags when to hire and when to chase work, and warns you when the team is heading toward overload.
The problem is that most teams track it in a spreadsheet, and the one thing a spreadsheet can't do is keep figures updated in real time. That’s a problem not just for capacity utilization: 40% of firms don't track profitability in real time and, as a result, 56% report budget overruns on more than 10% of projects.
Calculated by hand once a quarter, utilization is stale before you've finished totaling it, and by the time a problem shows up in the report, there's rarely room left to fix it.
Tracked live, it works the other way around, warning you early enough to act.
Factor handles the live tracking for you.
Real-time time tracking keeps your billable-hour data accurate, resource scheduling shows remaining capacity per person before anyone tips into overload, and utilization calculates itself as the work happens. Request a demo to see it in action.
Frequently Asked Questions
What is a good capacity utilization rate for A&E firms?
Firm-wide, aim for around 80%, with a goal of sitting in the 80-90% band.
Not that the right target shifts by role, however. Principals sit lower because business development and firm management eat into their billable time, while project architects and designers run higher since their work is mostly billable production.
How often should I measure capacity utilization?
Weekly for operational adjustments, and monthly for staffing and strategic planning.
The weekly read catches drift before it becomes a bigger issue, so you can reassign work or chase proposals in time to matter. The monthly view is where the bigger calls get made about hiring, workload, and pipeline.
What causes low capacity utilization?
The usual causes are poor forecasting, a mismatch between staff skills and the work on the books, admin bottlenecks that swallow billable time, and gaps between projects. It's rarely a shortage of talent, and more often a visibility problem.
What's the difference between capacity utilization and employee utilization?
Employee utilization is one person's billable share. Capacity utilization is the firm-wide or team-wide view of output against maximum potential. Individual figures roll up into the firm-wide rate, so both are worth tracking.

Recommended articles



See Factor in action
In one quick call, we’ll show you a simpler way to run projects and get paid faster.
.png)
“I recommend Factor to other firms. The team is great, it’s easy to use, and it has streamlined my project management. It can do the same for yours.”
Adam Mayberry
Architect / Managing Principal


