

A principal reviews staffing for the week, and the numbers look clean. The utilization report is healthy. Every project has people assigned to it, so everything appears manageable.
Two weeks later, a deadline slips because the same senior engineer was carrying work across three projects at once. In another instance, a fixed-fee job burns through its budget faster than expected. Initially, the plan was accurate when it was built, but it just stopped matching reality before anyone noticed.
That is where engineering resource planning breaks down in A&E firms.
The breakdown happens in the gap between what was planned, what people actually worked on, and what the project ultimately earned. Most firms don't see it until closeout.

What is Engineering Resource Planning?
Engineering resource planning is how A&E firms decide who does the work, when they do it, and whether the project can still deliver what the contract promised.
In practice, it means assigning architects, engineers, subconsultants, and project managers across active projects while balancing scope, deadlines, and available capacity.
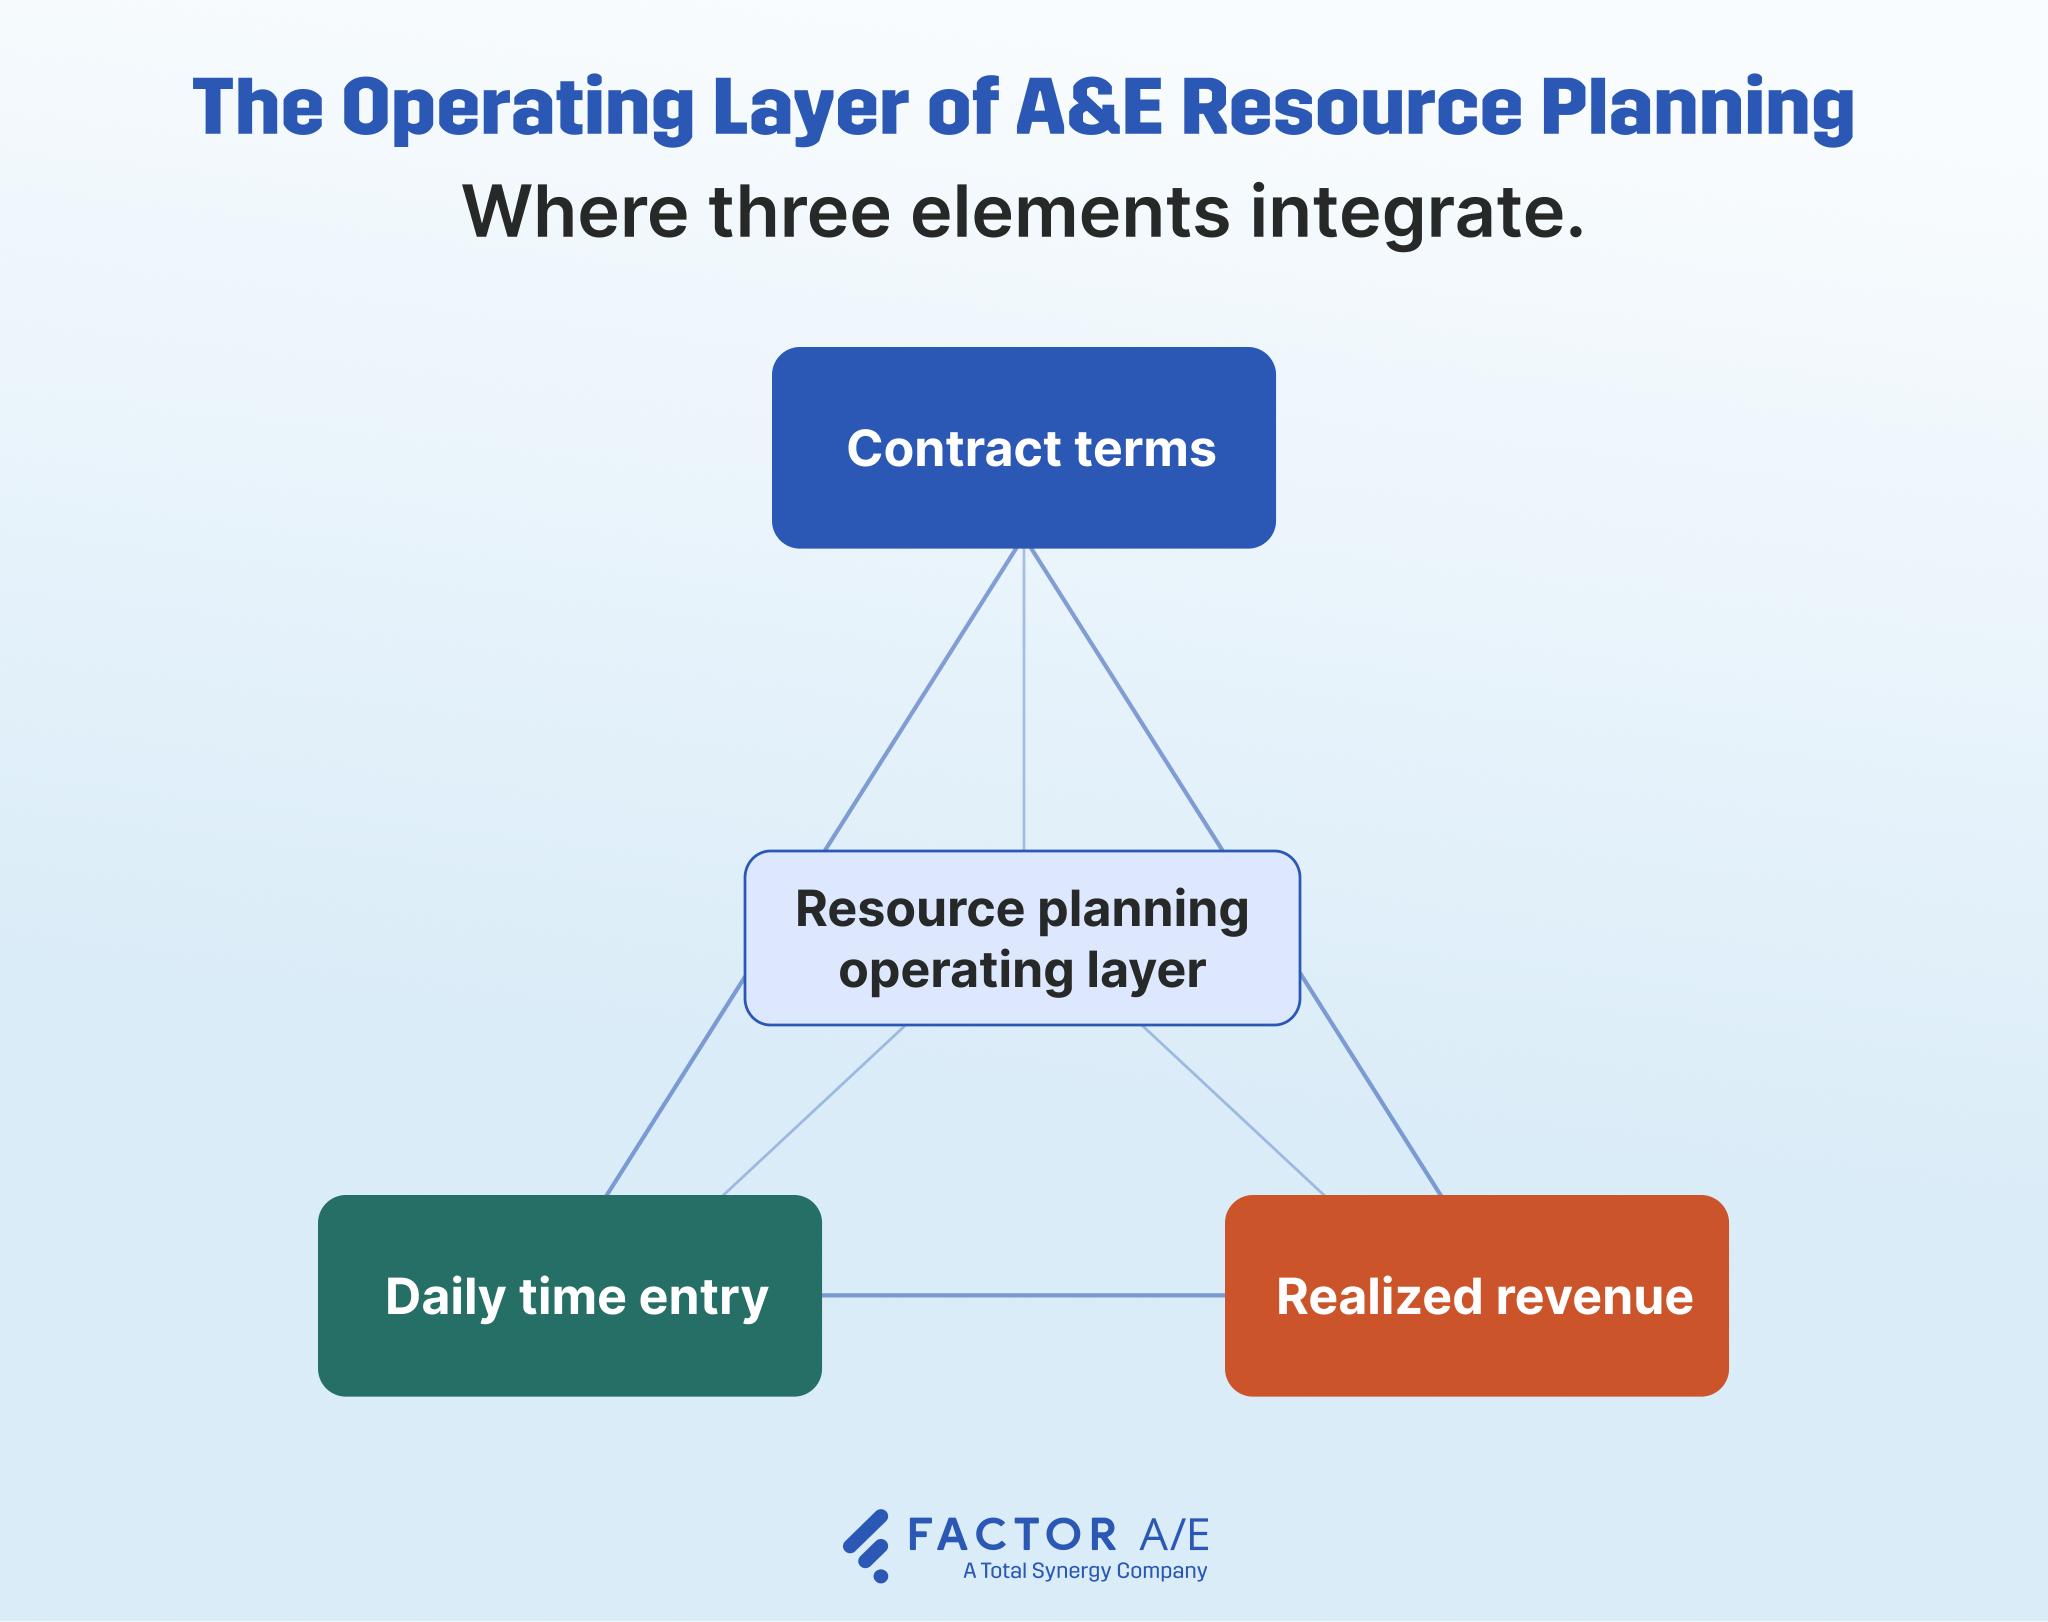
The challenge is making sure that what the contract assumed, what the team actually logs, and what the project ultimately earns don't drift as the work unfolds.
When those stay aligned, firms can identify problems before it's too late to respond. When they drift, the first clear picture often arrives at closeout.
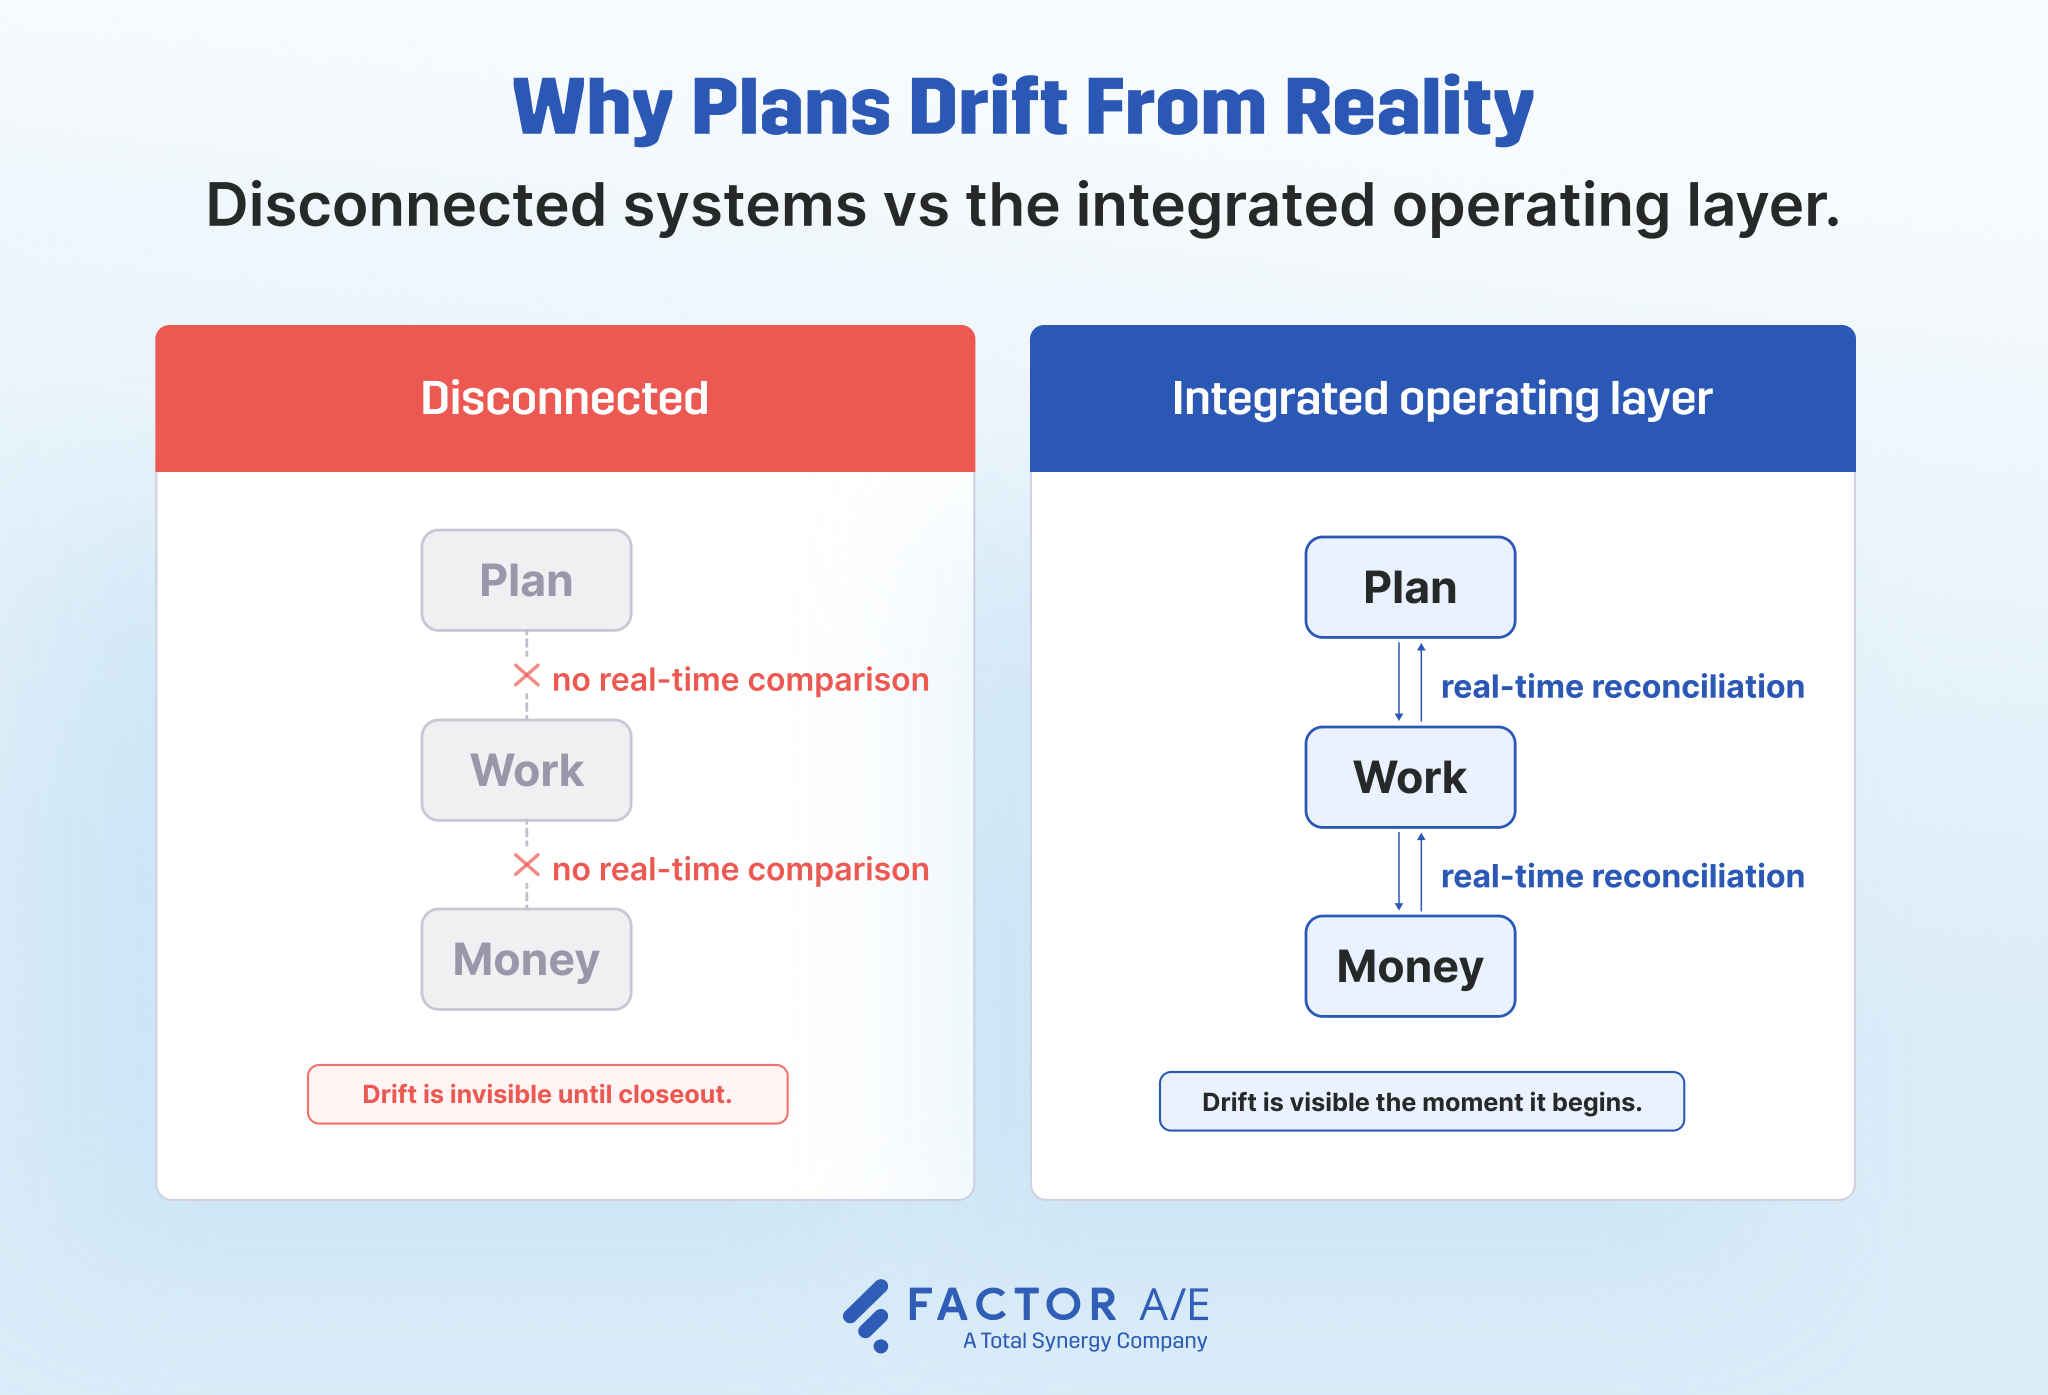
When those three integrate, the firm has visibility into how the plan, the work, and the money are tracking against each other. When they sit in disconnected systems, drift goes invisible until closeout.
Utilization often becomes the headline number because it is easy to measure. The problem is that high utilization doesn't necessarily mean the firm is healthy.
AIA Best Practices benchmarks A&E utilization at 60 to 65%, well below the 80 to 85% range that appears in generic resource-planning content.
PSMJ argues that meeting utilization targets alone can create problems. Senior staff become overloaded because billable work flows to the people clients trust most. Junior staff sit underused. Calendars fill up without anyone asking whether those hours are producing profitable work.
What firms ultimately care about is whether the effort put into a project translates into the revenue the project was expected to generate. That's where the realization rate becomes useful because it measures earned revenue against the effort required to produce it.
How to Build a Resource Plan in an A&E Firm
Resource planning starts long before the weekly review meetings and variance reports.
The first decision is deciding what the plan should optimize for, and that depends on the contract sitting in front of you.
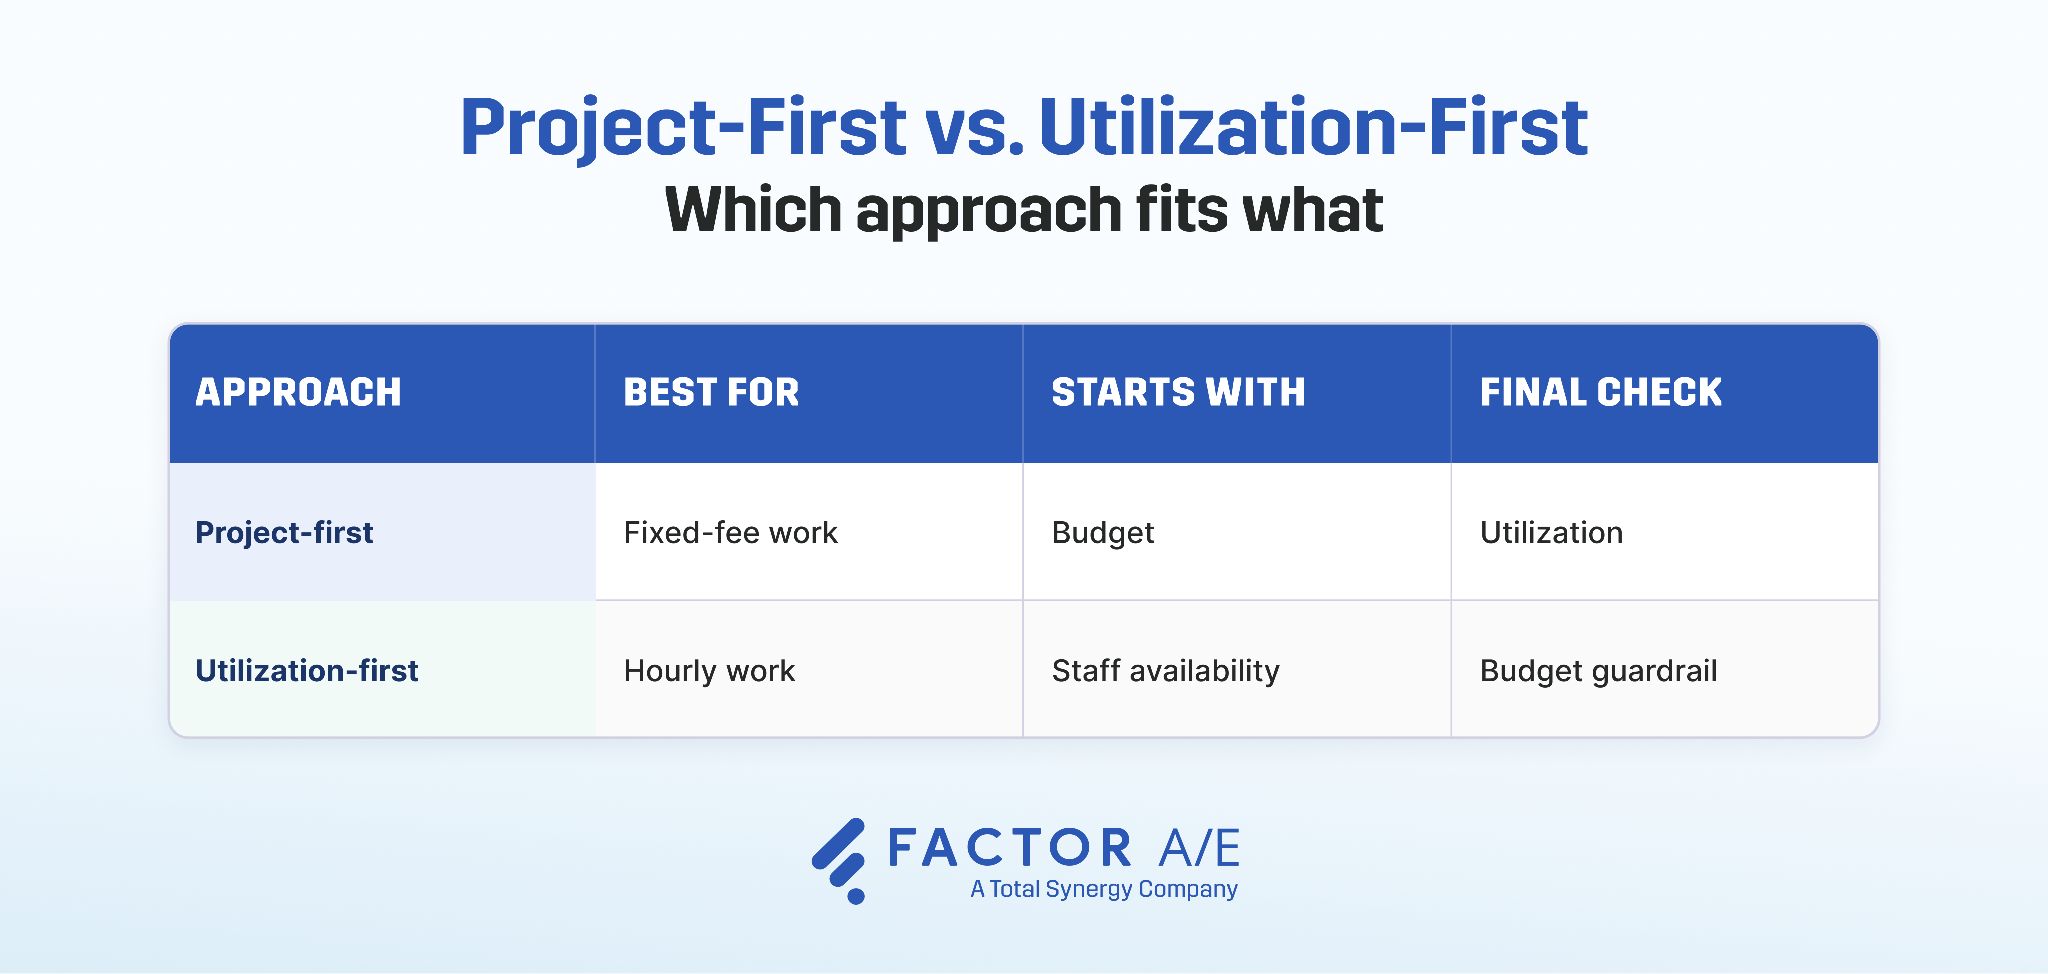
Project-first or utilization-first? Let your contracts decide
A fixed-fee project starts from the budget. The total fee is set, and the scope is defined. The question is how to distribute the available hours across phases and roles without breaking the envelope. Budget leads, then timeline follows, and utilization is the final check.
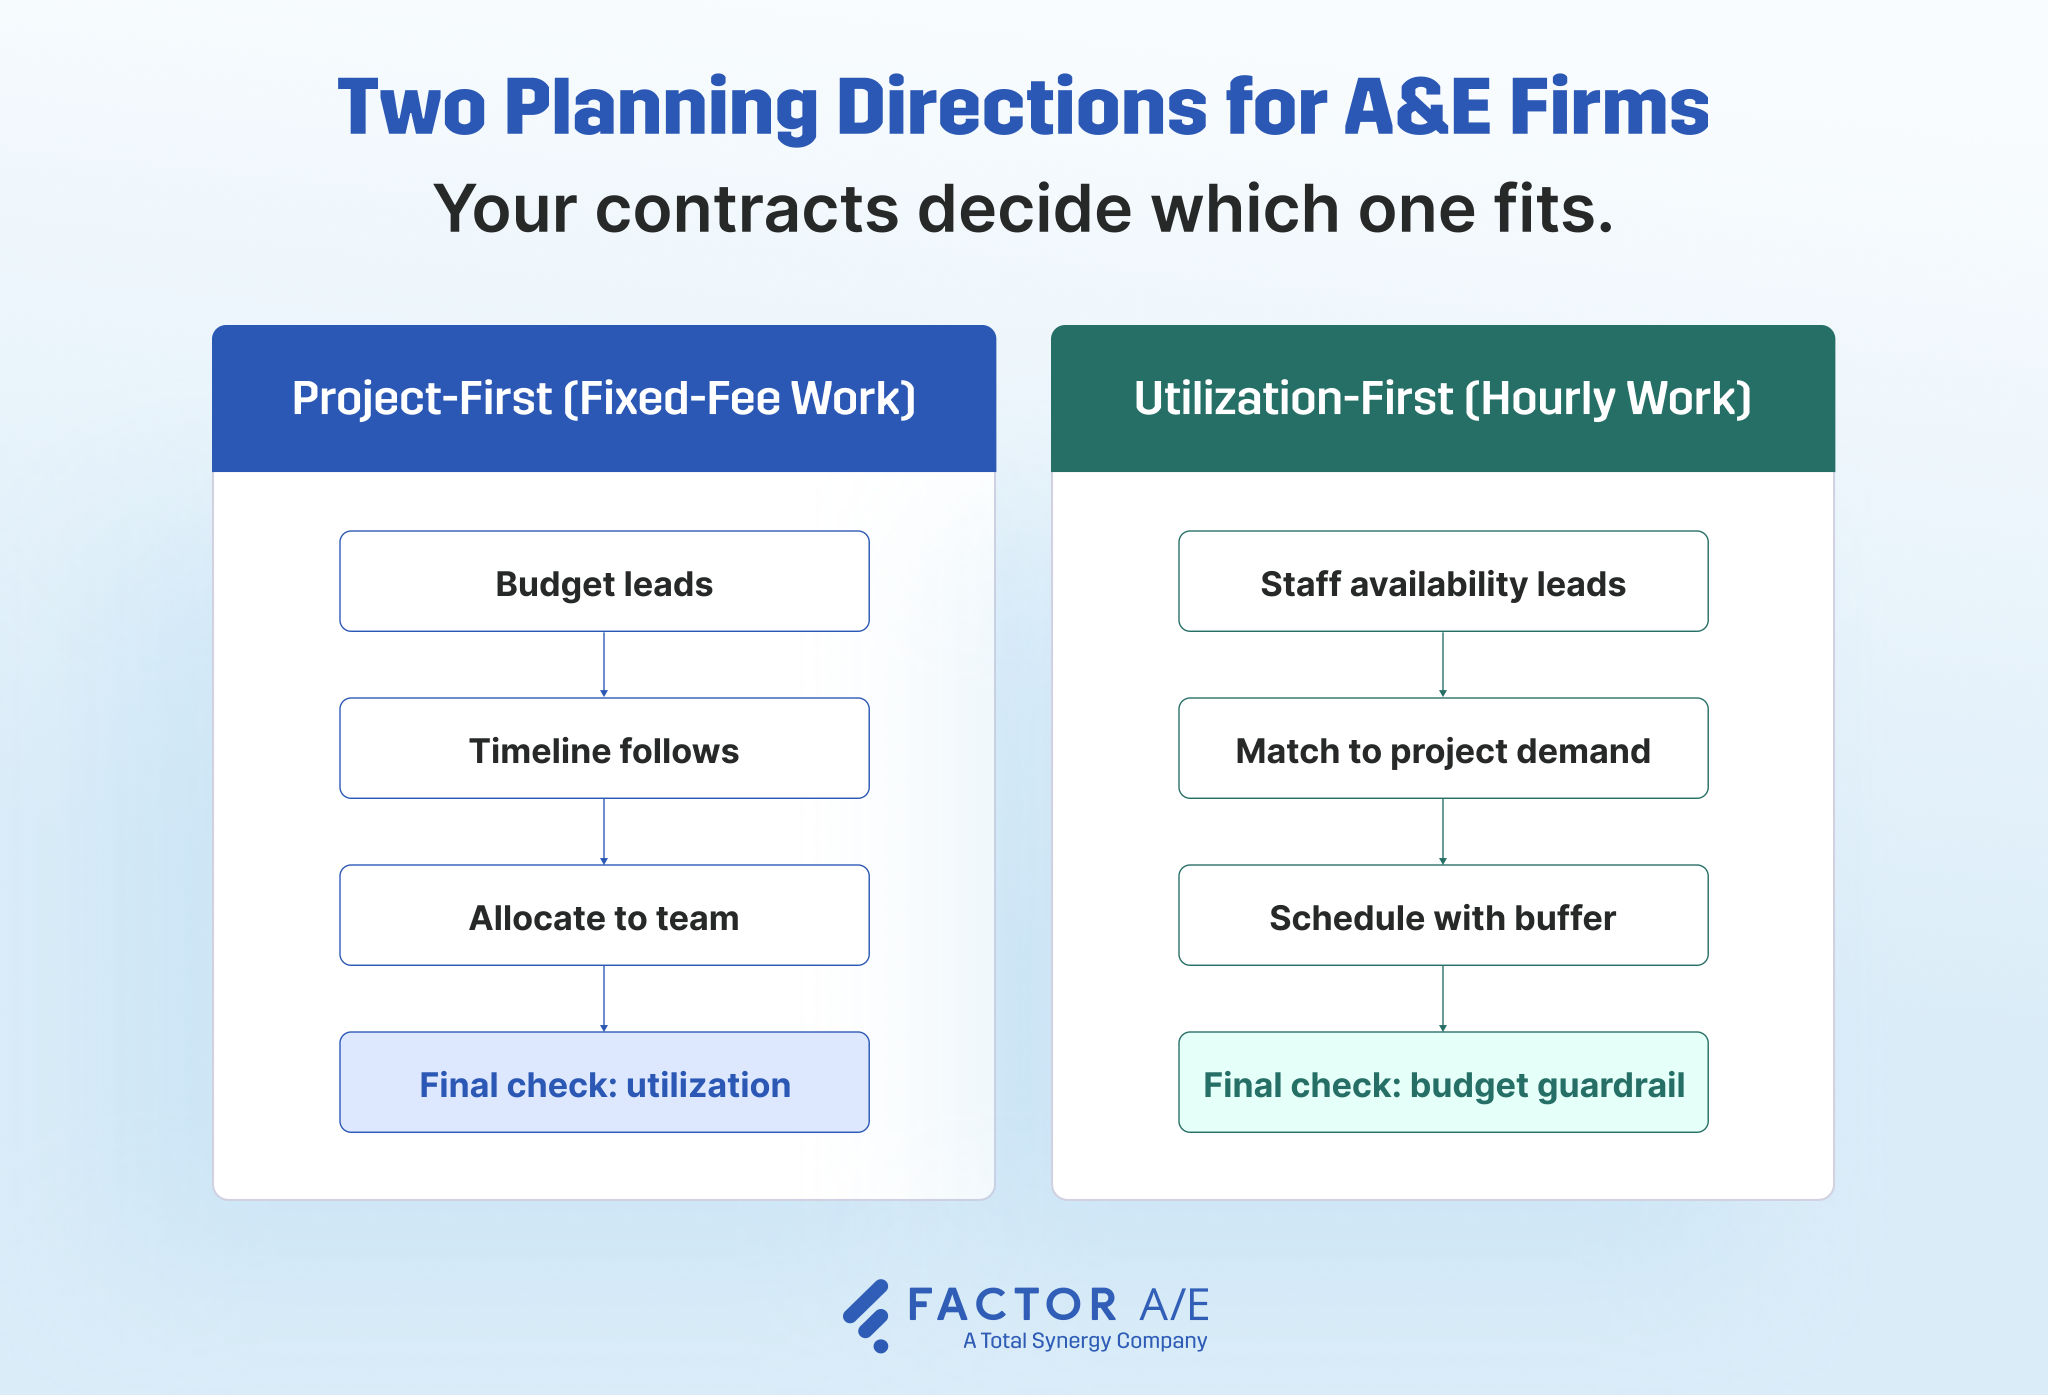
An hourly project starts with the staff. Every billable hour is revenue, so the goal is to keep capable people utilized without overcommitting them. Available time leads, and the focus is on staying inside what the client will accept. Budget becomes the guardrail rather than the starting point.
Most A&E firms run both approaches simultaneously. A residential fixed-fee renovation may sit alongside a commercial hourly fit-out and a public works job with mixed terms. Each follows a different planning logic. Treat them the same way, and the margin erodes before anyone notices.
The build cycle, phase by phase
Once the contract logic is clear, the work becomes much more practical.
- Intake the project. Confirm the contract type, scope, deliverables, and which costs are fixed versus variable. The assumptions made here shape everything that follows.
- Map the phases. For SD, DD, CD, and CA, or the structural and MEP equivalents, estimate the role-specific hours each phase will demand. Forty hours from a senior engineer during DD is a different commitment than forty hours during CA. The plan has to know the difference.
- Match skills to availability. Start with the internal team and a centralized view of capacity. Bring in subconsultants for specialist gaps. When specialists end up absorbing overflow work the firm didn't catch during planning, the cost of that missed signal compounds.
- Schedule with buffer. Plan around roughly 75 percent capacity, not 100 percent. Scope shifts. Clients miss deadlines. Engineers take sick days. Plan for the firm you run, not the one the spreadsheet describes.
- Set the planned-versus-logged baseline. Decide what you expect to spend in week two so you have something concrete to compare against in week three. Without that baseline, you don't know whether the project is drifting until the phase closes.
The last step matters more than it may seem, because without a planned-versus-logged baseline, there is nothing to compare against as reality starts to shift. By the time a phase closes, the opportunity to adjust has usually passed.
Why Your Resource Plan Drifts From Reality (And Why More Discipline Won't Fix It)
A familiar pattern: a project hits every milestone on time. The client is satisfied. The team feels like the job ran well. The closeout report lands, and the margin is well below the price.
Nothing visibly went wrong because the hours looked right and the team hit every scheduled milestone. But somewhere in the middle, the plan and the reality diverged, and nobody caught it until the numbers came in.
Here’s another pattern: a senior engineer’s capacity is spread across three projects at once. The utilization dashboard looks healthy. Junior staff have spare capacity. No fire alarms.
The cost of this drift rarely shows up all at once.
Margins erode without anyone seeing where they went. Senior staff carry workloads the firm never realized they had.
Pricing decisions rely on memory because actual labor data never finds its way back into future proposals. Every new project gets estimated using judgment and feel because the last three years of project data live in systems that don't connect.
Why discipline and better dashboards won't close the gap
Most firms respond by tightening the process.
Timesheet reminders go out. PMs are asked to update the plan more often. Partners are encouraged to check capacity before agreeing to scope changes.
Those steps help. They just don't solve the whole problem.
A team can follow the process and still miss the drift if the information needed to spot it is scattered across different places.
The same thing happens with software bought for reporting.
The demo focuses on dashboards. The reports look comprehensive. But those reports depend on information entered by the people doing the work.
If logging an hour means clicking through five menus, less gets entered and more gets reconstructed from memory later. The reporting improves on paper while the quality of the underlying information gets worse.
Tools built around outputs can end up undermining the inputs they depend on.
When planning lives in one system, time entry in another, and project finance in a third, the firm runs into the same problem: nobody can easily compare what was planned, what was worked, and what was earned.
What an integrated operating layer actually looks like
The plan sits in a scheduling tool. The work gets captured through timesheets, often days after the fact. The money lives in accounting.
When those systems cannot be easily compared, drift remains hidden until closeout.
The symptoms are familiar:
- Project managers cannot see phase-level margins.
- Budget drift surfaces after deadlines slip.
- Billable rates are tracked while pay rates are ignored.
- Teams work around the system instead of through it.
Resource planning is where the contract assumptions, the work being logged, and the money being earned come together. When those stay aligned, firms catch problems before it's too late to respond. When they don't, the first clear picture arrives at closeout.
None of this sits entirely with the PM or the engineer.
The systems firms choose determine whether people can compare what was planned, what was worked on, and what was earned while there is still time to adjust.
Without that comparison, even disciplined teams drift. In a partner meeting, here’s a diagnosis you can use:
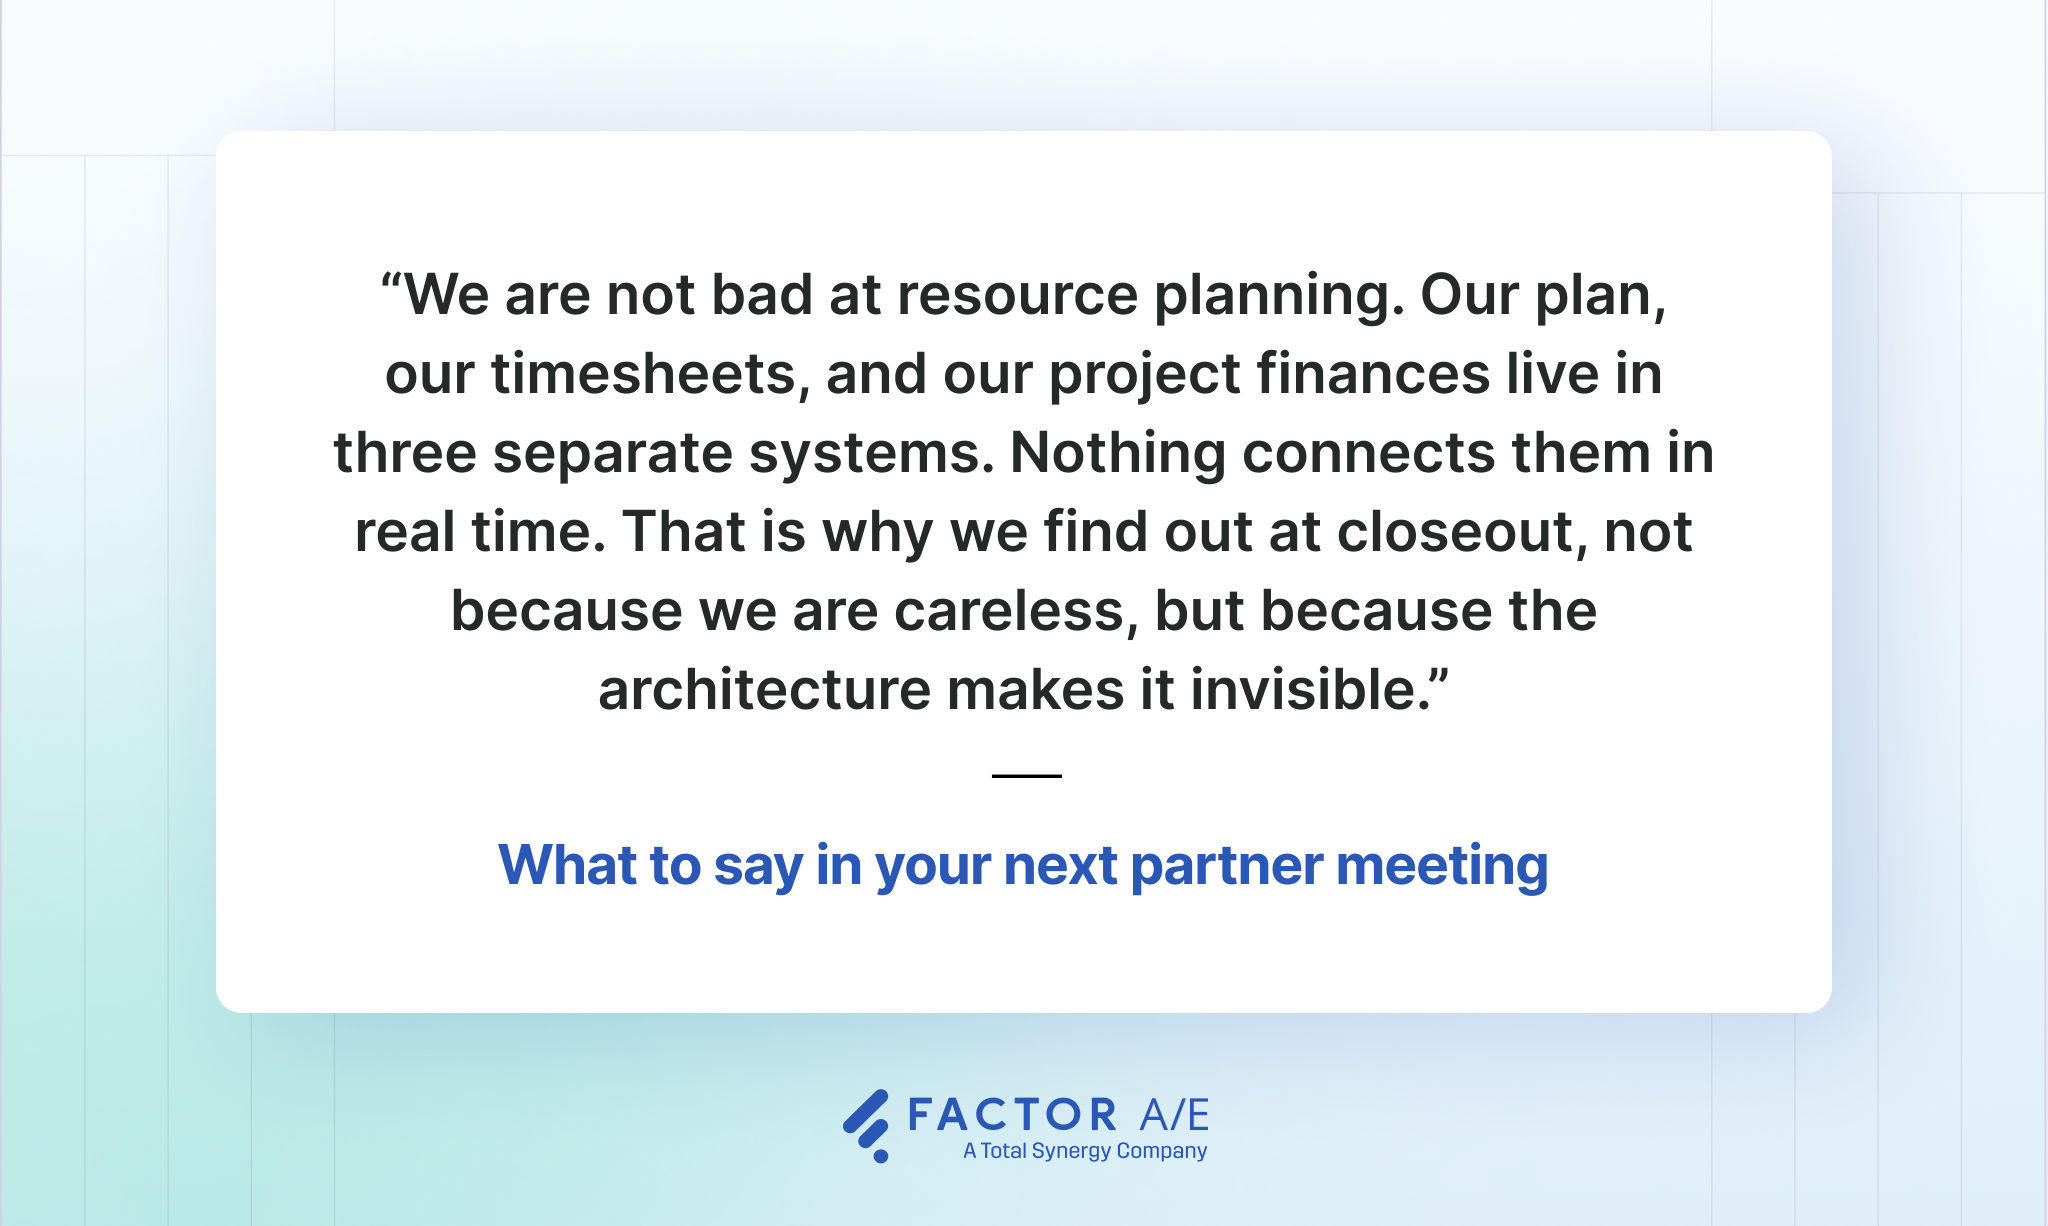
You cannot outrun a drift problem with more discipline alone, but you can build an operating layer that detects drift while there is still time to act.
How to Keep Your Resource Plan from Drifting
Once the plan is built, the work of keeping it useful begins.
A resource plan that isn't checked against reality starts to drift surprisingly quickly. The four cadences below are designed to catch different kinds of drift before they turn into closeout surprises.
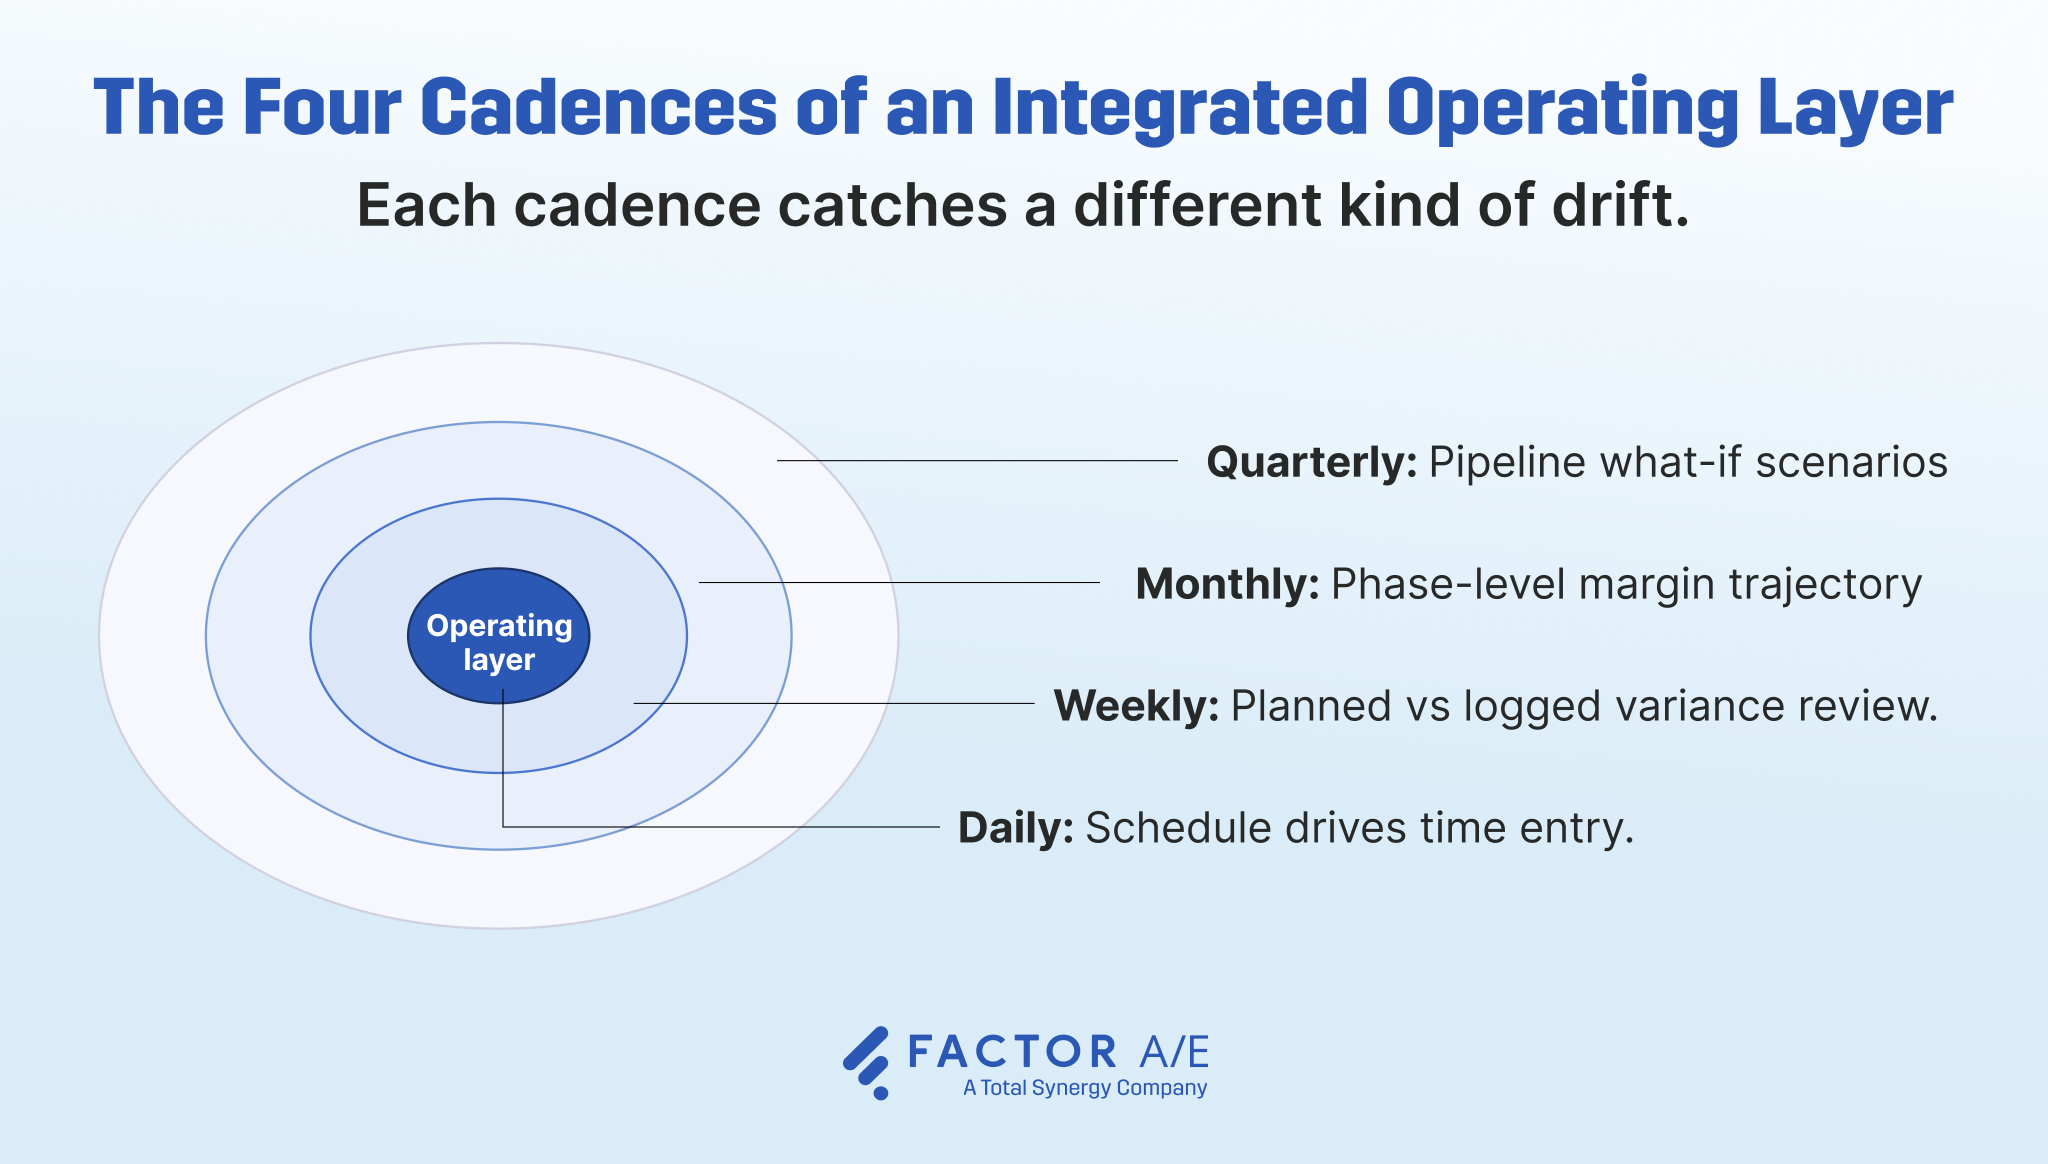
Daily: schedule drives time entry
The schedule is not a forecasting document. It is the structure employees use to log their time.
When an engineer opens the time-entry page, they should see what they were expected to work on that day. Any deviation should surface to them and the project manager the same day, not at month-end.
This collapses the planned-versus-actuals comparison into the act of capture. The lag that lets drift hide is removed by design.
The constraint is that this works only if PMs update the schedule before engineers log time. That is one additional daily habit at the PM level, and most firms do not currently run it. The day the schedule falls behind reality, the practice loses its function.
Weekly: variance review
Each Friday, pull the planned and logged hours for every active project from the prior week. Flag anything more than 10% over or under plan. Both directions matter because over-planning signals a risk of burnout. Under-plan signals scope ambiguity or idle capacity.
Ten percent works for firms with clean weekly time entry. If your data arrives 4 days late on average, widen the threshold; otherwise, the variance flag will fire constantly.
The constraint: this requires an uncomfortable conversation with the PM when hours are off plan. The discomfort is the point. It is what catches drift before the phase closes underwater.
Monthly: margin trajectory
Each month, for each active project, compare the planned phase-end margin against the current trajectory. This is the cadence that catches the fixed-fee job burning through budget in week four, while there is still time to re-scope before the phase closes. Realization rate is the right metric to track here.
The constraint is that this requires margin trajectory data at the phase level. Firms whose accounting systems report only at the project level cannot maintain this cadence without rebuilding their chart of accounts.
Quarterly: what-if scenarios
Most firms run their first what-if scenario the week after a key person gives notice or a major project slips. The point of a quarterly cadence is to run the scenario before that happens, when there is still capacity to adjust.
Quarterly is when you ask: if the hospital project slips two weeks, what happens? If we win the school RFP, who can carry the load? If our senior structural engineer takes paternity leave in Q3, where does the gap open? These questions turn reactive hiring into proactive capacity planning.
The constraint: this requires principals to protect a recurring meeting they might otherwise skip. The quarterly cadence fails because it is deprioritized when a deadline falls on the same day. That is the week the next capacity gap is being built.
Choosing Engineering Resource Planning Software
Spreadsheets work for resource planning up to a point. The point is that there are roughly three concurrent projects with shared specialists. Past that, three signals tend to appear together:
- Three or more concurrent projects sharing specialists. Once the same senior structural engineer is assigned to three projects, no spreadsheet can keep the allocations consistent across phase changes.
- Multi-discipline workflows. When architecture, structural, and MEP work all happen on the same projects, the cross-team coordination breaks spreadsheets faster than the project count alone.
- Weekly scope changes that go stale within hours. When the plan you updated on Monday morning is wrong by Tuesday afternoon, the tool is the problem.
Five questions to ask any resource planning vendor
When evaluating software, anchor the conversation to the practices above. Five questions cut through the demo theater:
- Does the platform map to your contract type, or does it assume one approach?
- Does scheduling drive time entry, or do they live in separate modules? A vendor demoing scheduling and time-entry as separate workflows is showing you the architecture this guide just described as broken.
- Does it track pay rate alongside billable rate, so the true margin is visible?
- Does it surface phase-level margin in real time, or only at closeout? If margin numbers only appear in an end-of-month report, the platform will not catch the phase that is bleeding in week three.
- Does it give project managers direct visibility and control, without routing every change through admin?
The right vendor depends on your contract mix, firm size, and existing finance stack. The questions above allow you to interrogate the demo rather than accept the vendor's framing.
Factor AE was built around the comparisons on which this article depends.
The schedule shapes what engineers see when they log time. Contract type influences how the plan is built from the beginning. Phase-level margins are visible before closeout.
Project managers and principals work from the same picture instead of passing information back and forth through admin.
The goal isn't more reporting. It's spotting drift while there is still time to respond.
Build a Resource Plan That Doesn't Drift
When a PM sees a 15% variance in week two, there is still time to replan the phase. When they see it at closeout, there isn't.
The next time a partner asks why the margin came in low, the answer shouldn't be, "We'll do better next time."
It might be that the plan lived in one system, time entry in another, and project finance in a third. The comparison that could have surfaced the drift never happened until the project was over.
That's a fixable problem.
The firms that catch drift early aren't necessarily better at predicting the future. They've built a way to compare what they planned, what the team actually worked on, and what the project is earning while there is still time to respond.
Factor AE was built to support that way of working. If you'd like to see what it looks like in practice, schedule a demo to see how firms are using Factor AE to build resource plans, monitor drift, and make adjustments before small variances become margin surprises.