

You finalized the staffing plan, and the backlog said the next quarter was covered.
Then a major project paused, a start date shifted, or a proposal you expected to convert stalled in procurement.
Suddenly, the numbers no longer aligned. Finance had one version of reality, project teams had another, and leadership was left figuring out what had changed and what decisions needed to change with it.
Factor's 2026 A&E Industry Benchmark Report found that seven in ten firms still manage resources manually, increasing the likelihood that they turn away work due to staffing constraints.
Revenue forecasting rarely breaks because firms choose the wrong method. More often than not, the information behind the forecast changes faster than the forecast itself.
What is Revenue Forecasting for A&E Firms?
Revenue forecasting for an A&E firm is the projection of future net service revenue against signed work, expected project timing, and available capacity over a defined period. The canonical unit is net service revenue (NSR), not gross.
Michael Webber's AIA income statement guide explains why: "gross revenue includes subconsultant pass-through that the firm never earns, which overstates scale and distorts every downstream metric."
Most firms already do some version of this. The challenge isn't understanding the math. It's keeping the forecast aligned with what is actually happening inside the firm as projects move, schedules shift, and staffing plans change.
In A&E firms, three realities make that harder than it sounds:
- Fixed-fee projects can lose margin long before anyone sees it in a report.
- Revenue follows project phases and milestones, with timing often known first by the PM closest to the work.
- One delayed or paused project can make a freshly reconciled forecast outdated almost immediately.
Why Revenue Forecasting Breaks for A&E Firms
A&E revenue forecasts usually break for two reasons, and neither has much to do with the forecasting method itself.
The first cause is architectural. The four sources (what is signed, when each project lands, who can deliver, and what each project costs) live in four systems that don't talk to each other: a CRM, a PM's head, an Excel sheet, and QuickBooks.
Once a month, someone pulls them together into a master spreadsheet. By the time it's finished, it's already stale, and the next pause in the project or scope change has invalidated the assumptions.
The same benchmark report finds 40% of firms don't track project profitability in real time, and 42% don't track their profit margin at all.
The second problem is adoption. Software is often chosen for the reports leadership wants to see, while the people responsible for entering the information evaluate it later, if at all.
The result is predictable: leadership gets the dashboards it asked for, while project managers avoid a system that slows them down. The forecast may look sophisticated, but the information feeding it arrives late, incomplete, or not at all.
Core Architecture, a 50-person firm in Pleasant Grove, Utah, ran into the same issue with Deltek Ajera. Project managers couldn't access accurate billable rates; the team defaulted to manual spreadsheets, and Curtis Miner at Core explained why: "With Deltek Ajera, if we wanted a custom report, it would take 2 months and be $500."
The problem wasn't unique to one platform. Kaas Wilson, a 120-person firm using a different system, found that a clunky time-entry process discouraged staff from entering hours consistently, leaving the firm with incomplete information.
Once these problems take hold, even sound forecasting practices become harder to trust. The methods and metrics that follow still matter. They simply depend on information that stays current enough to reflect what's actually happening inside the firm.
Revenue Forecasting Methods A&E Firms Use (With Pros and Cons)
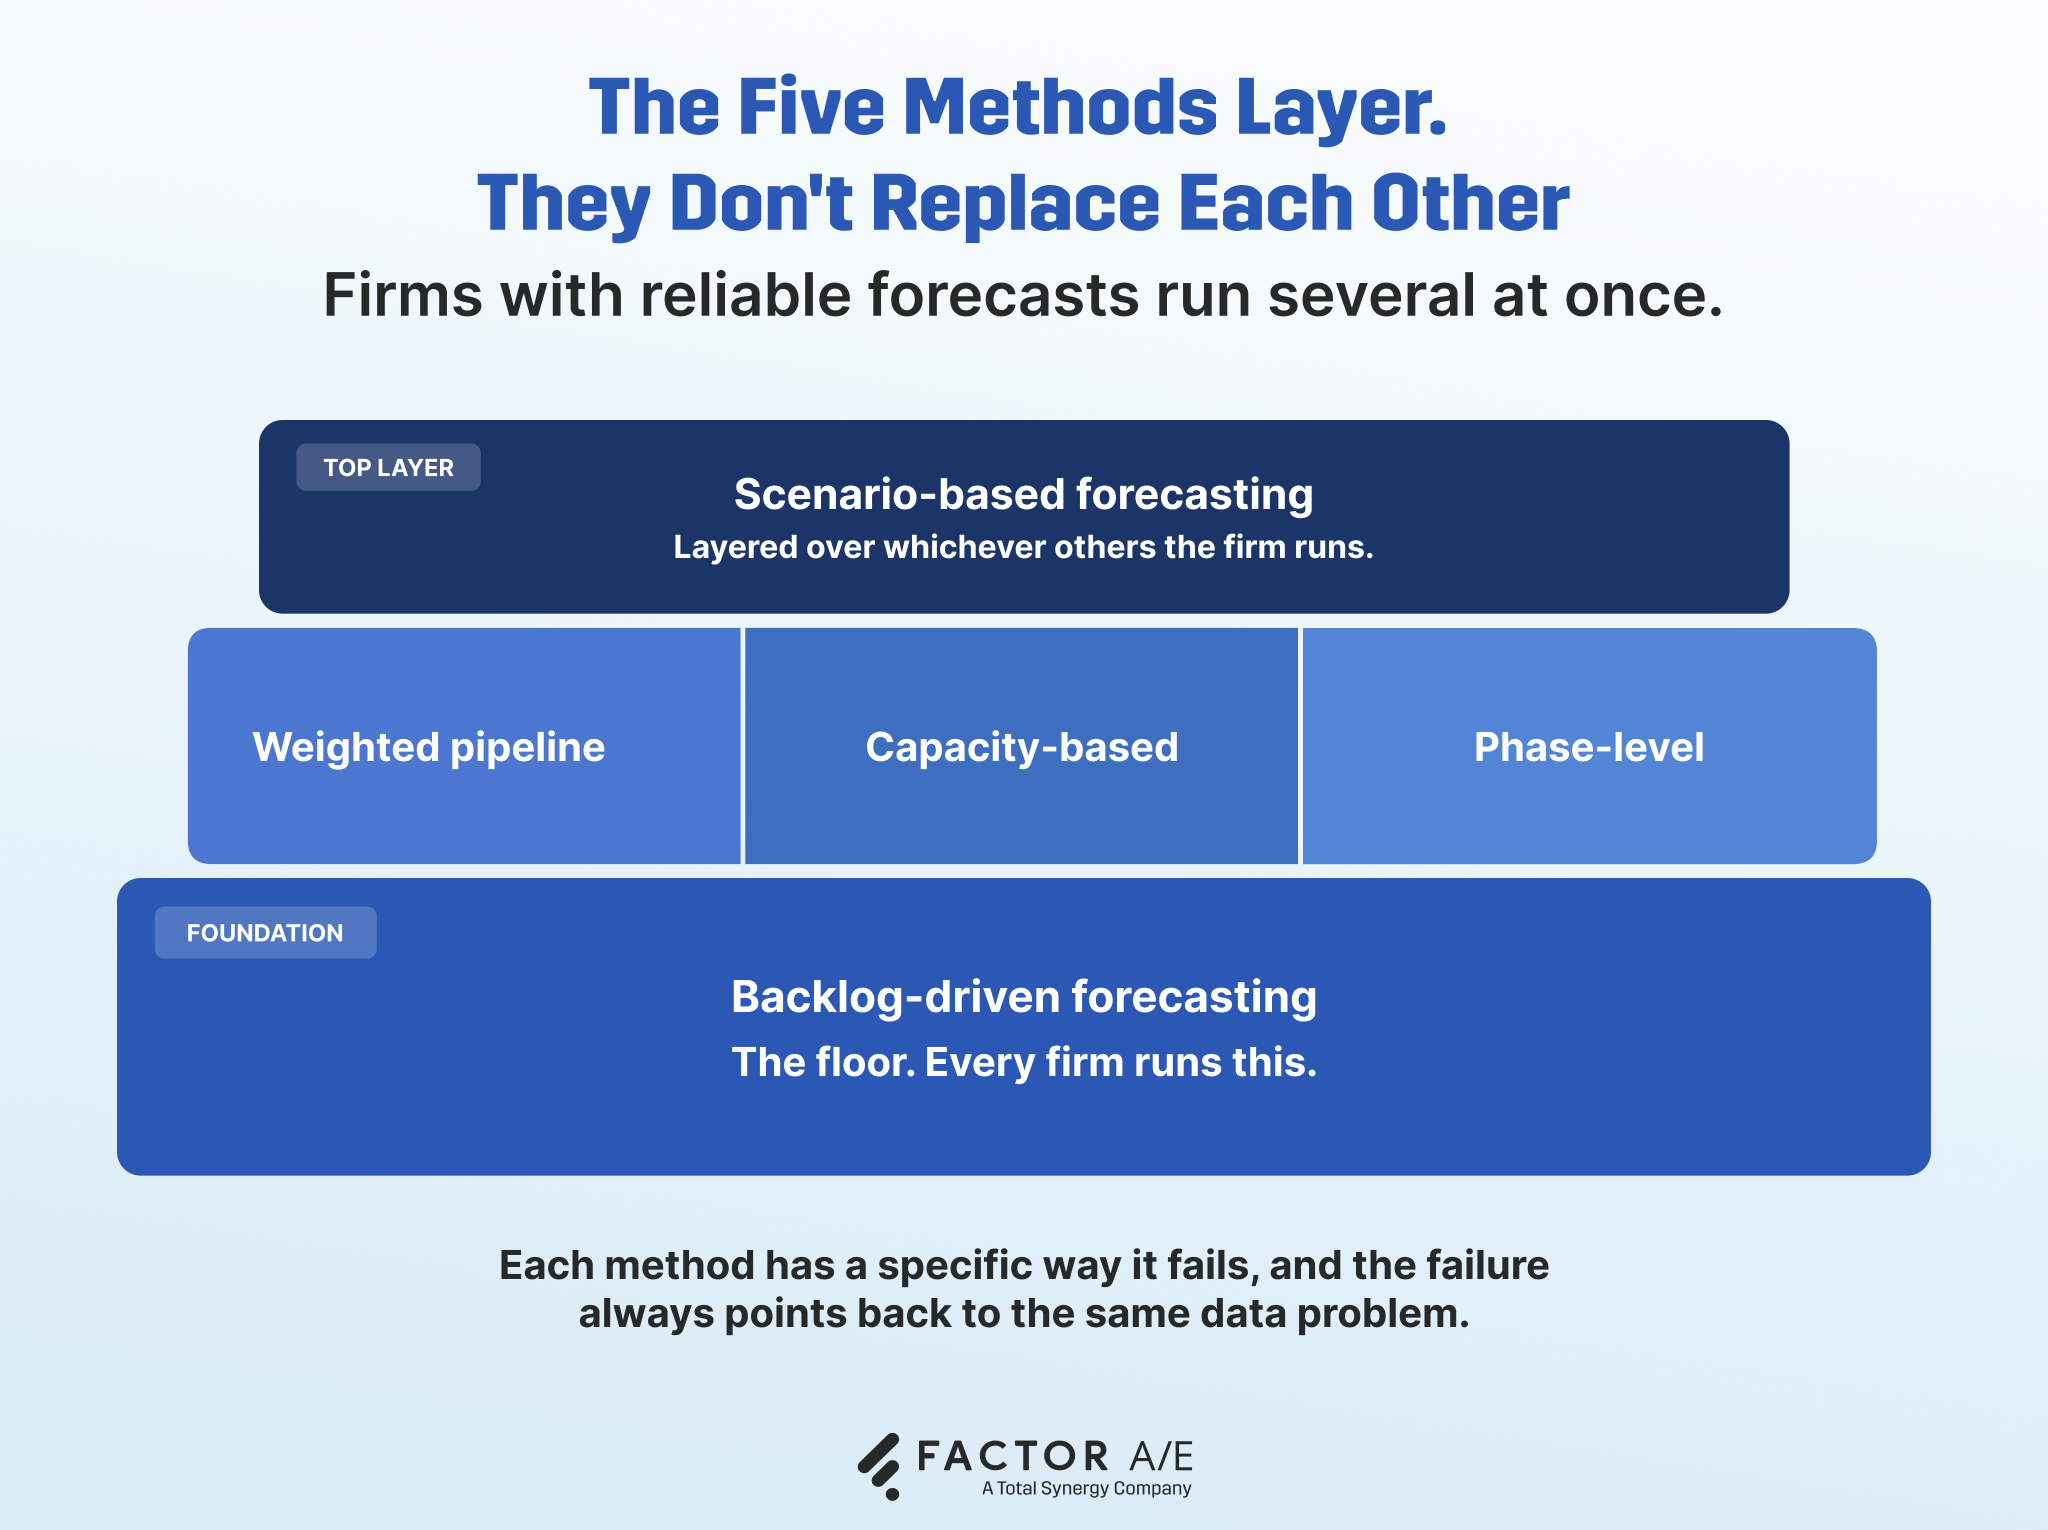
There isn't one "right" way to forecast revenue in an A&E firm. Most firms use a mix of methods depending on the question they're trying to answer. Each has strengths and blind spots as you’ll see below:
Backlog-driven forecasting
Best for: Every A&E firm. Use it as the foundation of the forecast, not the forecast itself.
Backlog-driven forecasting projects future revenue from signed work that has not yet been billed. In practice, firms spread remaining contract value across future months based on expected project phases and delivery schedules.
Its weakness is timing. A backlog report can look healthy on Tuesday and become misleading by Thursday if a project pauses, accelerates, or slips into procurement. The contract value hasn't changed. The timing has.
The safeguard is to update phase schedules as soon as project conditions change. Backlog without current timing creates false confidence in future capacity and can lead firms to hire, delay, or pursue work based on revenue that won't arrive when expected.
Weighted pipeline forecasting
Best for: Firms with a tracked proposal pipeline. If proposals live in an inbox, this method can't run yet.
You closed a quarter at 60% because a "70% likely" project never signed. That's weighted pipeline forecasting failing, as it most often does: by disguising optimistic assumptions as precision.
The method applies percentages based on the stage of the pursuit process to active proposals. It works best when those probabilities are based on your own win history, segmented by project type and client type. Generic CRM defaults tend to inflate the forecast.
Back-test last year's pipeline against what actually closed, then recalibrate the probabilities.
Capacity-based forecasting
Best for: Firms where staffing decisions need to be anchored to revenue projections.
Capacity-based forecasting asks a simple question: Can your team actually deliver the work you're projecting?
The method estimates future revenue by multiplying available billable hours by billing rates. It breaks down when capacity assumptions no longer reflect how people actually spend their time. A team can look available on paper while deliverables are already slipping.
Time-entry completion is often the first warning sign. Review it weekly rather than monthly. In his AIA accounting basics guide, Webber notes that firm-wide utilization is optimized at around 60-65%. An average utilization number across teams can support a confident hiring recommendation for a group that is already overbooked.
Phase-level forecasting
Best for: Firms doing fixed-fee work where revenue is earned across multiple months.
Phase-level forecasting aligns revenue with actual project progress rather than calendar assumptions. Using the AIA's five standard phases from the B101-2017 contract (schematic design, design development, construction documents, procurement, and construction), it forecasts revenue based on work completed within each phase.
It breaks when projects continue to follow the original schedule despite changes in reality. A delayed deliverable, an expanded scope, or an accelerated phase can cause the forecast to overstate or understate what the firm will actually earn.
Review phase status regularly and update the forecast as conditions change. The closer the forecast stays to the work itself, the earlier margin issues become visible.
Scenario-based forecasting
Best for: Decisions with meaningful downside cost, such as hiring rounds, office expansion, or major business development investments.
Scenario-based forecasting layers base, upside, and downside projections over whichever forecasting method you already use.
Its weakness is maintenance. Most scenario plans collapse into a single "most likely" view within weeks because updating three projections instead of one triples the reconciliation work nobody wanted in the first place.
For A&E firms, the assumptions worth stress-testing are pipeline win rates, backlog burn rates, and utilization levels. Scott Armstrong's "Golden Rule of Forecasting," built from 150 experimental comparisons, found that conservative scenarios outperform optimistic ones, reducing forecast error by an average of 28% per guideline applied.
None of these methods is inherently flawed. Most forecasting failures occur when the assumptions underlying them no longer reflect what's happening inside the firm.
Pro tip: for more detail, we’ve prepared a full revenue forecasting guide for A&E firms.
5 Metrics That Drive Accurate A&E Revenue Forecasting
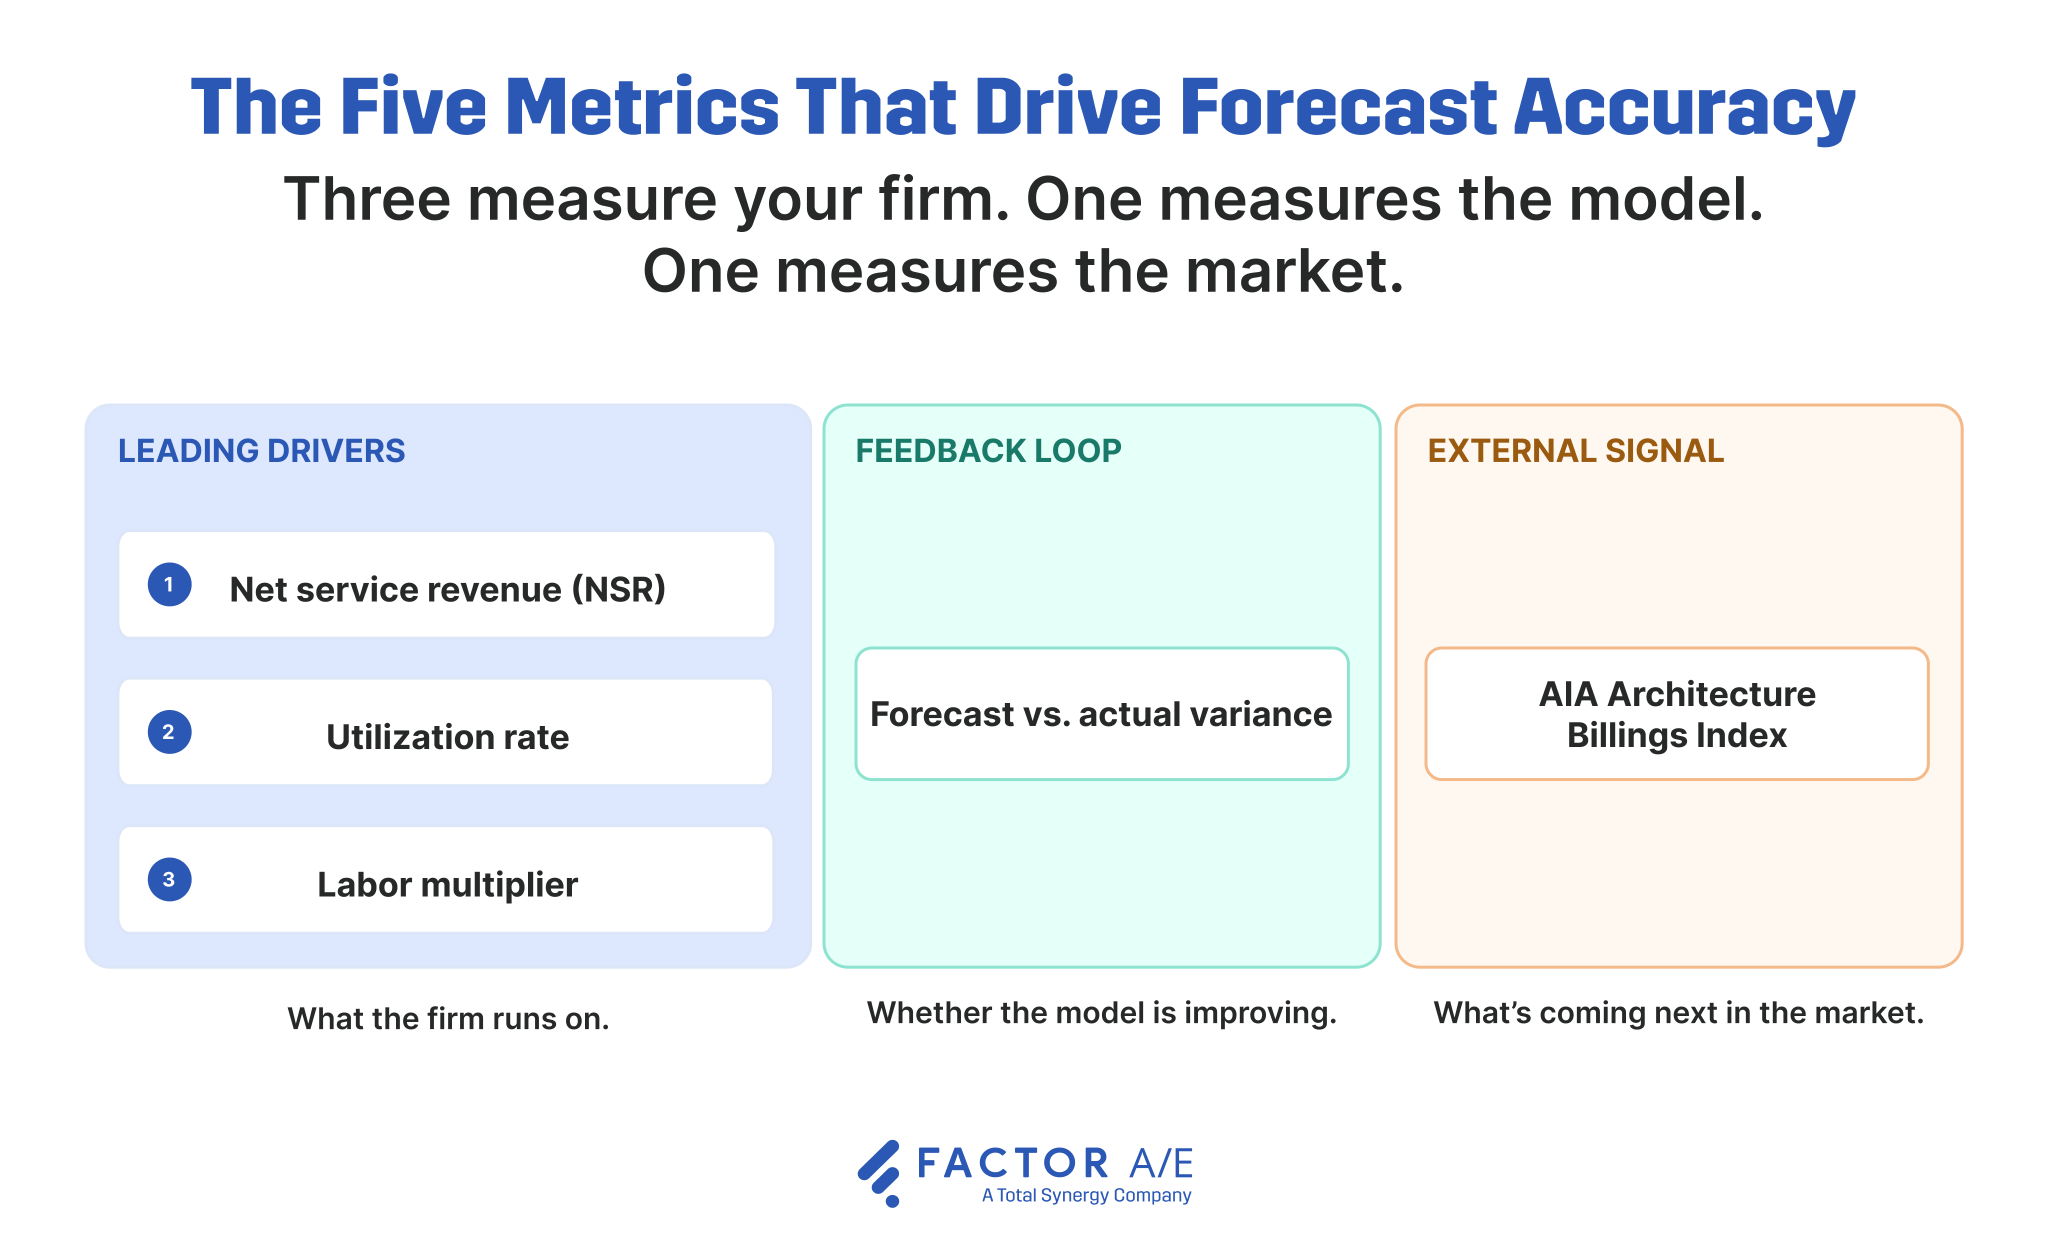
Five metrics determine A&E forecast accuracy. There are leading indicators (NSR, utilization, multiplier), a feedback loop (variance), and an external signal (the AIA Architecture Billings Index).
Forecasts improve when firms stop chasing more metrics and start paying attention to the few that reveal whether the assumptions underneath the forecast still hold.
1. Net service revenue
Net service revenue is what's retained after subconsultant pass-through and direct project costs come out. Webber's AIA income statement guide names NSR as the canonical A&E benchmarking unit: gross includes the subconsultant's cut, which inflates the overhead rate, multiplier, and every other metric built on top of it.
Two failures show up in the data layer: pass-through is treated as firm revenue, and fixed-fee scope creep remains invisible until phase close. In your firm, separate subconsultant fees in your project ledger before running any revenue figures.
2. Utilization rate
Utilization rate measures the percentage of staff time spent on billable client work. The benchmark report found that 58% of firms reported utilization rates of 71% or higher.
The number breaks when everyone gets averaged together. A firm-wide utilization rate can mask both an underloaded production team and an overextended PM team. Misclassified non-billable hours and inconsistent time entry only deepen the distortion.
Track utilization separately for project managers and production staff, and exclude non-billable PM time from the headline number. The goal is to understand where capacity actually exists.
3. Labor multiplier
The labor multiplier compares net service revenue to direct labor costs. It answers a simple question: how much revenue does the firm generate for every dollar spent on labor?
The metric fails without anyone noticing it. A healthy multiplier on paper can disappear once current compensation costs are loaded into the system. Firms often track billable rates while relying on outdated or incomplete pay assumptions, turning the multiplier into an exercise in optimism.
Without current pay rates in the system, the multiplier becomes an assumption rather than a measurement. Load compensation data alongside billable rates before calculating profitability at either the project or firm level.
4. Forecast vs. actual variance
The forecast-versus-actual variance compares projected revenue with the revenue ultimately billed during the same period. Without it, the forecast becomes a record of confirmation bias rather than a planning tool.
The failure mode is cadence. Firms review variance at year-end, long after there's anything left to correct. A persistent positive bias usually means pipeline probabilities are too optimistic. A persistent negative bias suggests phase timing assumptions are too aggressive.
A forecast never checked against actuals is a budget that stopped being revised. Run a monthly variance review and assign one person ownership of the reconciliation.
5. Architecture Billings Index
The AIA Architecture Billings Index (ABI) is a diffusion index, with 50 marking the threshold between expansion and contraction. Because architecture activity tends to lead construction activity, the ABI can provide an early signal of changing demand conditions.
The index won't tell you which projects will stall or which clients will pause spending. What it can do is indicate whether the environment surrounding your pipeline is strengthening or softening.
Firms often misread the ABI by treating a single month's result as a prediction or dismissing it altogether because they "have specific clients." Monitor the rolling three-month average instead, and treat sustained sub-50 readings as a prompt to pressure-test assumptions around pipeline conversion, hiring plans, and future workload.
How to Run Accurate Revenue Forecasting in Your A&E Firm
By this point, the mechanics of forecasting are relatively straightforward. Choose the methods that fit your firm, track the metrics that tell you whether the assumptions still hold, and recalibrate when they don't.
The harder part is keeping all of that current as projects shift, scope expands, and teams grow.
That's where most A&E firms start to feel the limits of their existing systems.
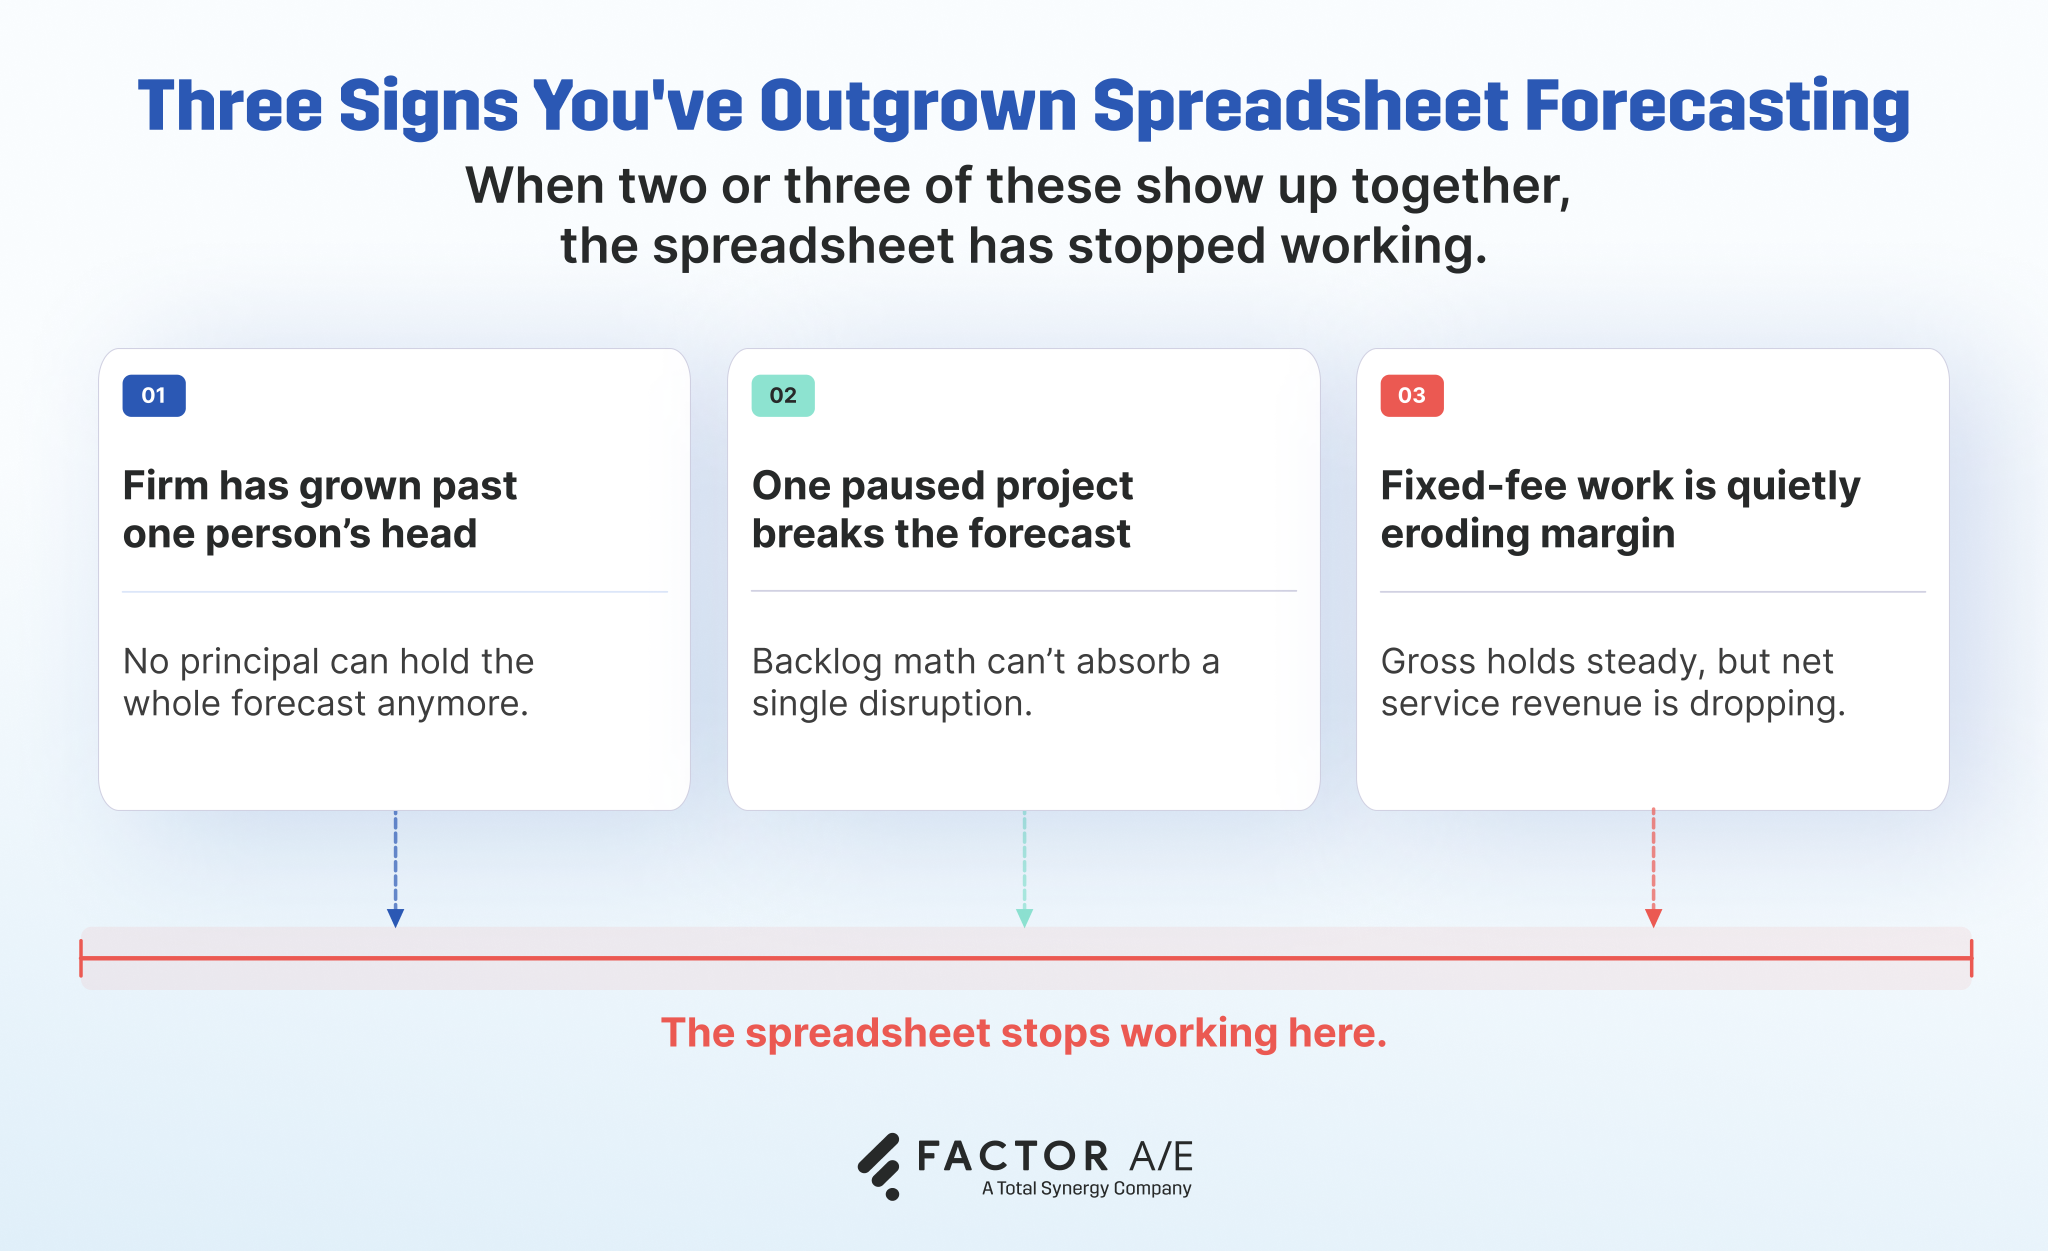
When your firm has outgrown spreadsheet forecasting
The shift rarely happens all at once.
A principal who once knew every project by heart finds it harder to keep track of what changed. A project pause affects staffing plans in ways backlog alone can't absorb. Fixed-fee scope creep starts eroding net service revenue while gross revenue still looks healthy.
Hours get copied from individual timesheets into a master spreadsheet. Project updates sit in email threads waiting for reconciliation. Every meaningful change to the forecast triggers another round of checks to determine which version of the numbers reflects reality.
That doesn't mean spreadsheets are the wrong tool. Tarantino Engineering Consultants, a 15-person structural and forensic engineering firm in Fulton, Maryland, relied on QuickBooks and spreadsheets for years.
Eventually, as the firm grew, "legacy tools like QuickBooks and spreadsheets could no longer support their operational needs."
For growing firms, that spreadsheet stack can remain practical for a long time. The challenge comes when keeping it current takes more effort than the forecast itself.
The constraint shifts, and the forecast is no longer limited by the quality of its underlying assumptions. It's limited by the firm's ability to keep the underlying information up to date.
What A&E forecasting software does that spreadsheets can't
In a spreadsheet process, someone has to stop what they're doing, collect updates from different places, and rebuild the picture. Project status changes. Hours get entered late.
A proposal moves forward or stalls. The forecast catches up when someone has time to reconcile it.
A connected system shortens that lag. Project managers update the phase status as part of running their projects. Time flows into the same system people already use. Financial information updates alongside the work itself.
Leadership doesn't wait until month-end to understand what changed, because the forecast already reflects information that's being captured.
QuickBooks records the accounting history, but it doesn't understand project phases. Most PM tools help teams deliver work, but stop short of showing what those changes mean for revenue and profitability.
A&E-specific systems bring those pieces together so firms can see signed work, work in progress, likely work, and capacity in the same place.
Steve Starr of Starr Design described the difference this way: "If a client puts a project on hold mid-month, the team can immediately redirect focus to keep monthly revenue on track."
After implementing a forecasting process built around the firm's phase-based methodology, Starr Design reported producing 30% more work than in its previous best year.
How to choose A&E forecasting software that your team will use
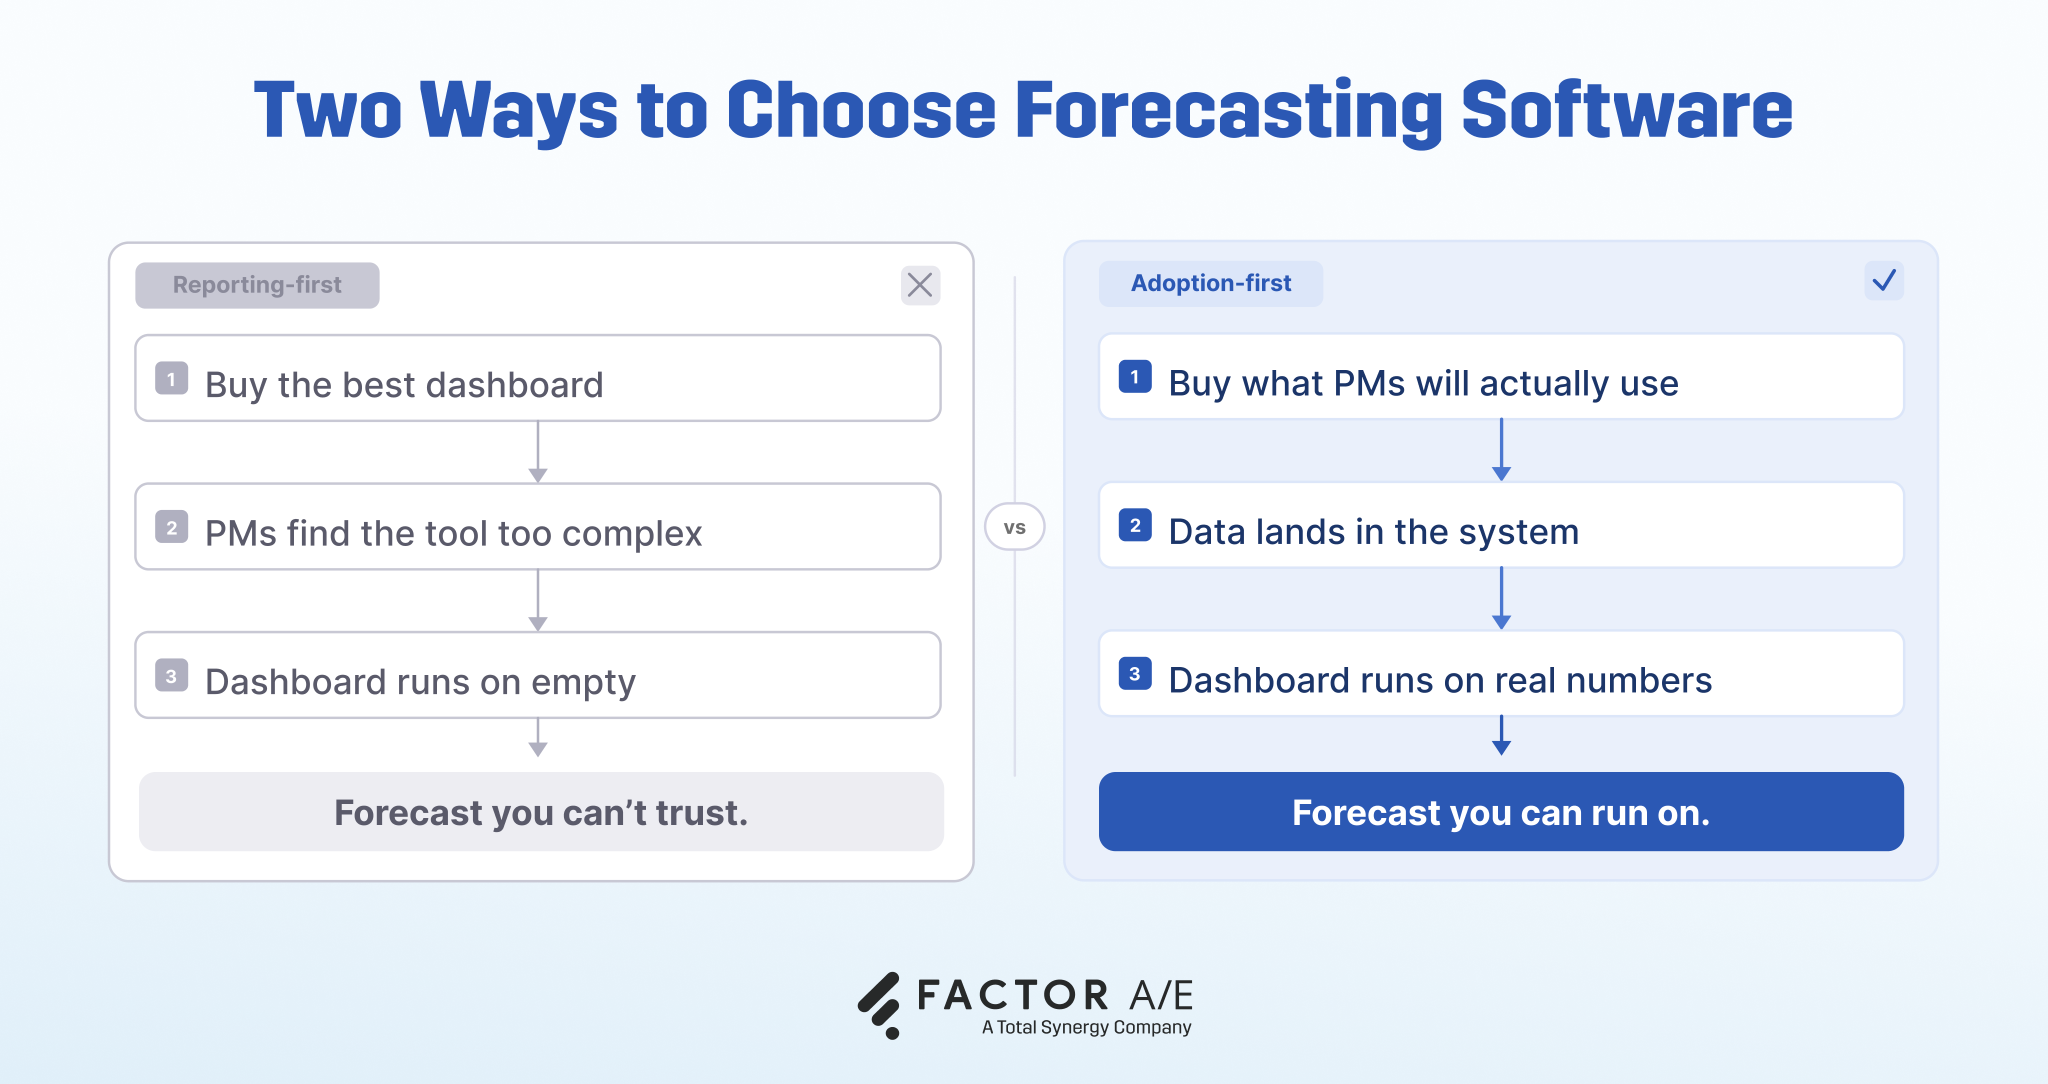
Forecast accuracy depends on the information that people actually enter.
Firms often evaluate software based on the reports leadership wants to see. The risk is ending up with sophisticated dashboards built on incomplete information because the people closest to project reality avoid the system that feeds those reports.
When evaluating options, ask four questions:
- Will project managers actually use it to enter time consistently?
- How quickly can leadership trust the numbers coming out of the system?
- Can the vendor show evidence of adoption in firms like ours?
- Does the system fit the way project managers already work, or does it require them to change how they operate?
The shift isn't that project managers become accountants. They gain enough visibility to spot problems before they become surprises.
As Dana Ibach, CFO at Kaas Wilson Architects, put it: "Factor makes numbers easier to understand for non-number people, which makes my job as a CFO a lot easier. PMs can keep an eye on profitability a lot easier."
Know the trade-offs before you buy
No forecasting system optimizes for everything. Systems designed around adoption may offer less reporting flexibility than enterprise platforms built for highly customized controls. The right choice depends on where your firm is today.
Factor is built for firms that have outgrown spreadsheets and need project manager adoption as the foundation of their forecasting process. Firms below that threshold may not need it yet. Firms with complex enterprise requirements may decide differently.
The encouraging part is that adoption tends to reveal itself quickly.
Altura Architects reports saving 15 to 20 hours each month on invoicing, while Core Architecture achieved full adoption within its first billing cycle. Teams either incorporate the system into the rhythm of their work, or they don't.
If project managers still avoid the system after the first few weeks and billing cycle, that's useful information. It's easier to reconsider a decision early than spend years building forecasts on incomplete data.
Build the Forecast Your A&E Firm Actually Runs On
A forecast is only as reliable as the information feeding it. When project data lives in disconnected systems and gets reconciled at month-end, leadership is always looking backward.
Factor helps growing A&E firms build forecasts from information that's already part of the work. Project managers enter time in a system designed for them, project financials stay current, and leadership can see changes in workload, revenue, and capacity before they become surprises.
Instead of debating which spreadsheet is right, you get a forecast you can trust to make hiring decisions, plan resources, and understand what's coming next.
See how Factor helps A&E firms forecast with confidence.