How to Create WIP Reports To Improve Cash Flow for A&E Firms
Learn how to create accurate WIP reports that improve cash flow for your A/E firm—track unbilled work, reduce revenue gaps & make smarter financial decisions


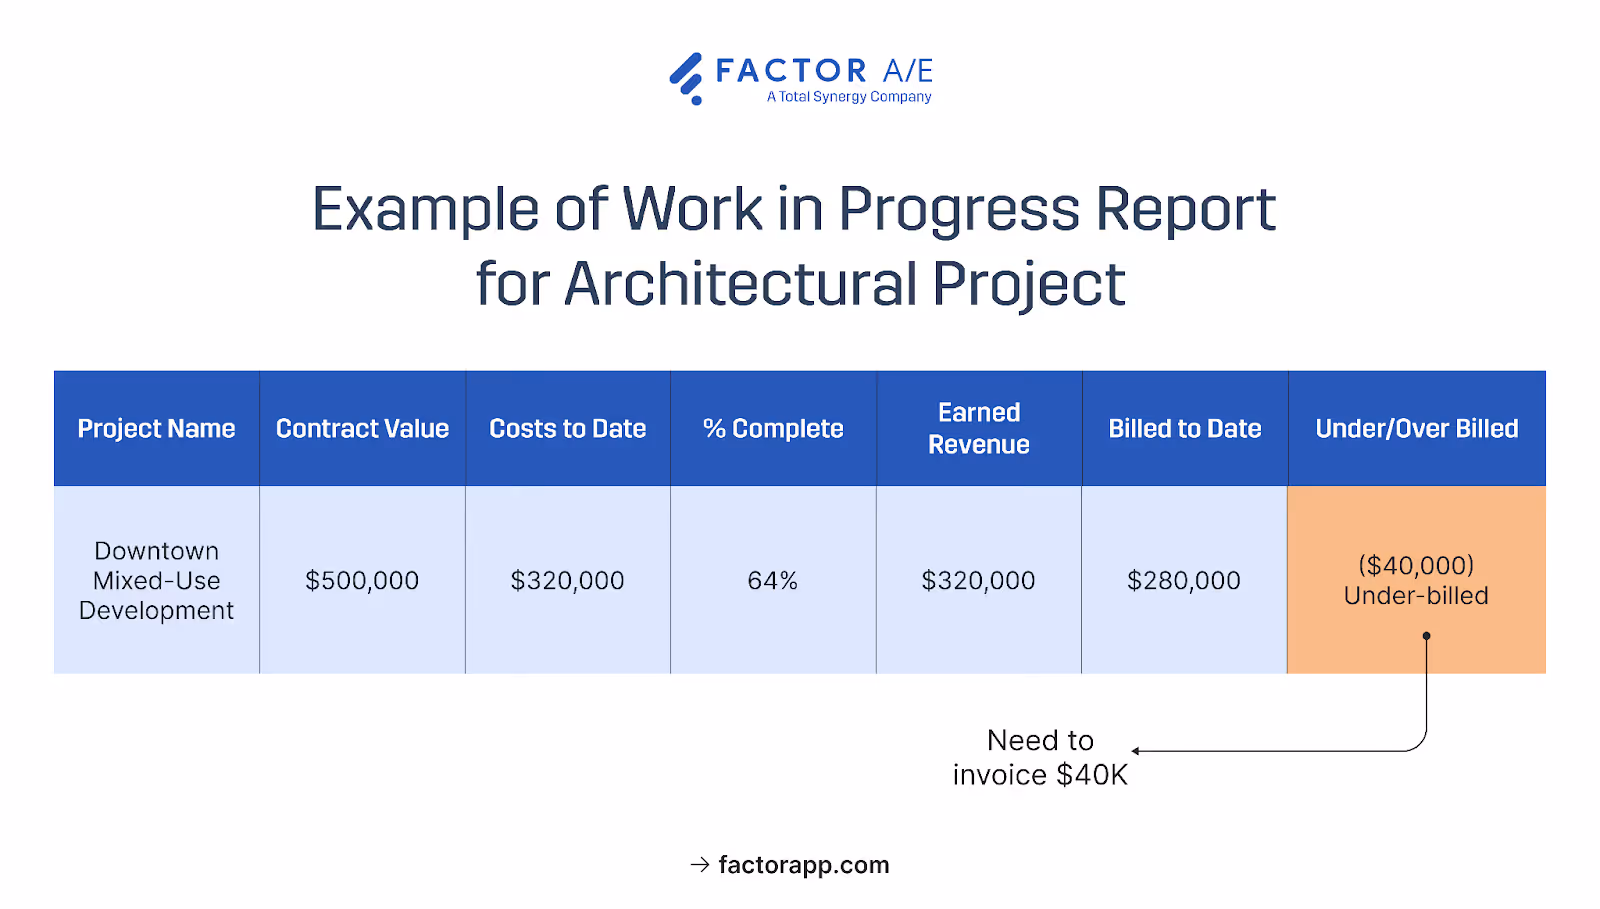
Your WIP report says the mixed-use project is 65% complete and profitable.
But your structural drawings are stalled. Your MEP consultant has just requested a scope change, and your client has not yet approved the last two invoices.
The report tells one story, and the project tells another. Which version are you using to make decisions?
This is the frustration with most WIP reports. They tell you what already happened, and by the time you run the numbers, the margin erosion is weeks old.
The phase that went over budget closed out before anyone noticed. You're not managing projects, you're documenting history.
Forecasting and tracking project profitability in real-time are typically one of the top challenges for A&E firms, and being able to create accurate WIP reports is a good way to tackle this issue.
This guide will help you build WIP reports that work differently. You'll learn how to track financials phase by phase, catch subconsultant costs before invoices surprise you, and spot margin problems while you can still do something about them.
What is a WIP Report?
A Work in Progress report tracks the financial status of ongoing projects at any point in time. Unlike traditional accounting, which waits until a project is complete, WIP reporting gives you visibility into project profitability as work progresses.
For A/E firms, however, WIP calculations become complicated quickly.
Your schematic design phase may be a lump sum, while construction administration bills are paid hourly.
Your subconsultant invoices might arrive three weeks after the work is complete. Or the percentage-complete calculation indicates 60%, but the zoning package is only half-finished.
Generic WIP templates miss these nuances. You get reports that look complete but hide what you actually need to know, such as:
- Phases that are bleeding budget
- Projects that have completed work that you can’t bill
- Consultant costs haven't hit your books yet
The four components below address these gaps.
Key Components Every A&E firm's WIP Report Should Include
If your WIP report can't tell you whether you've billed for all the work you've completed, it's tracking the wrong things.
Most generic templates track totals: total contract, total costs, and total billed. But A&E projects don't work in totals. A profitable SD phase can mask a CD phase that's hemorrhaging hours. A project that looks 65% complete might have a critical deliverable that's only half done.
These four components provide phase-level visibility, enabling you to identify cost overruns, billing gaps, and consultant fees while you can still take action.
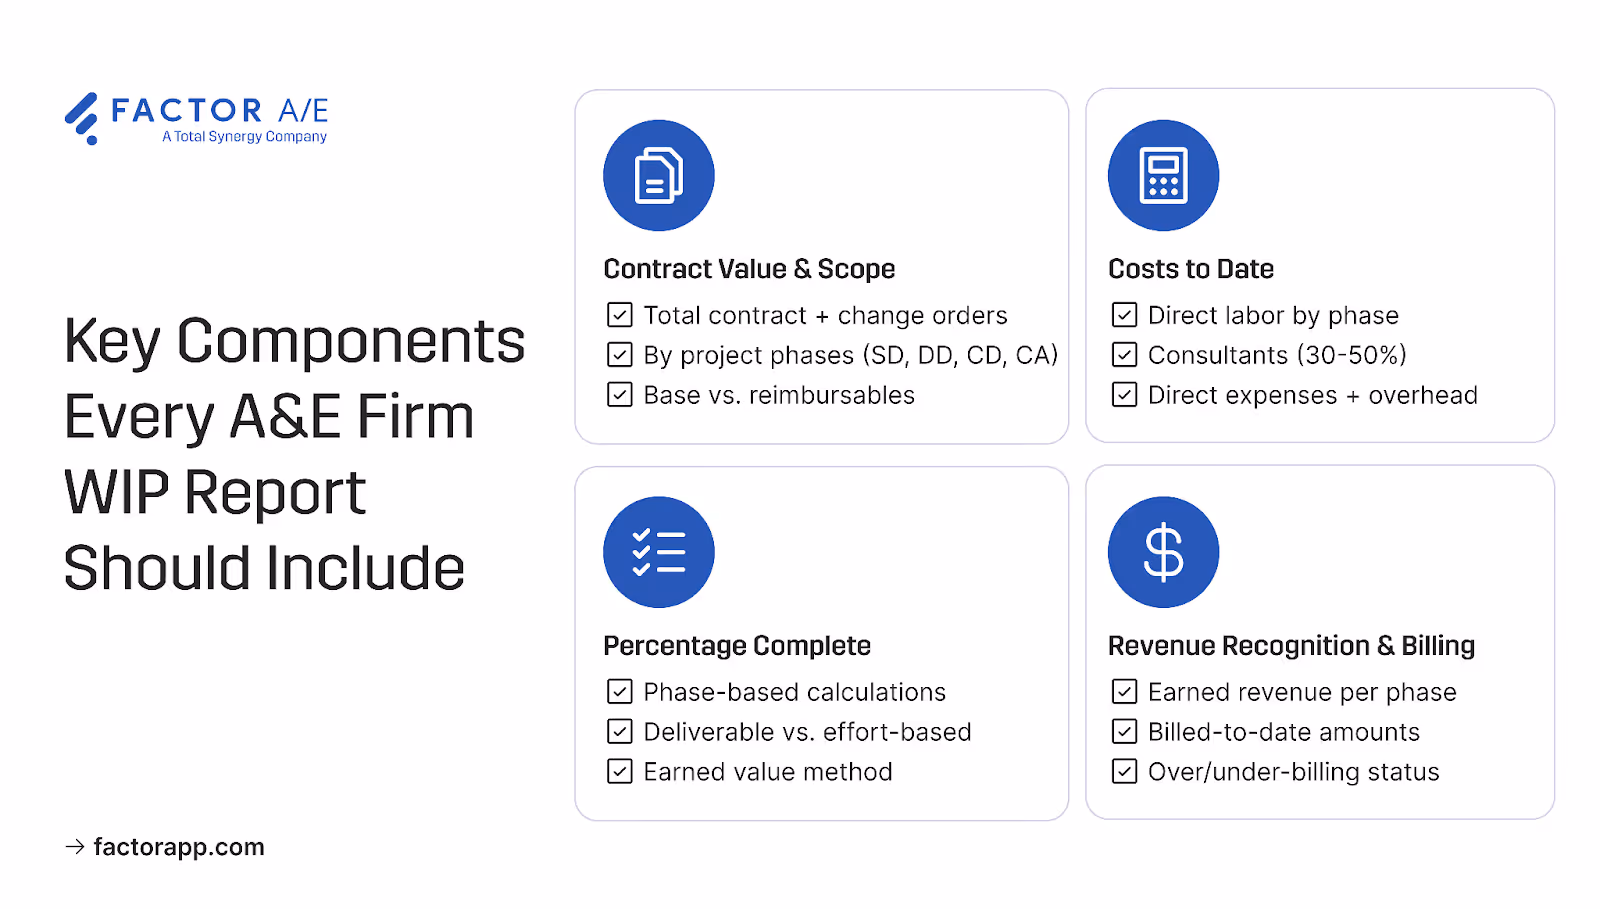
Contract value and project scope
Your WIP report begins with the total revenue opportunity, which includes the contract amount, approved change orders, and additional services.
The problem is that "total" hides where the money actually goes. A&E projects run through multiple phases: DD, CD, and CA. Each phase has its own budget, billing method, and margin.
When you only track the project total, you don't see that CD is burning through hours until the whole project shows a loss.
Phase-level tracking changes this. When SD, DD, CD, and CA each have their own budget line, you see CD running hot in that phase's numbers, not months later in the project total.
The same logic applies to reimbursables. Travel, printing, and subconsultant markups have different margin implications than direct labor. When they're lumped together, you lose visibility into the project's actual cost to deliver.
Costs to date by category
Direct labor is the obvious cost to track. But it's often not the biggest one.
Consultant and subconsultant expenses can run 30-50% of total project costs, and their invoices arrive on their schedule, not yours. This is where WIP reports often start to lie. Your project appears to be healthy, with a 40% margin. Three weeks later, the structural engineer's invoice arrives, and you're at 15%. The margin erosion has already occurred, and you're only finding out now.
Accruing consultant costs based on their progress, not their invoicing, closes this gap. When your MEP consultant is 60% through their scope, reflecting 60% of their fee in your WIP means the margin you're seeing is the margin you actually have.
Direct expenses and overhead work the same way. A project that appears profitable based solely on labor costs might break even once travel, printing, software, and overhead expenses are factored in. Tracking only direct labor understates the cost of delivering projects.
Percentage complete calculations
Sixty hours logged doesn't mean you're 60% done. If the primary deliverable is a zoning package that's only half finished, calculating completion based on hours will overstate your earned revenue.
Your WIP shows you've earned $30K, but the actual work shows $15K. By the time the deliverable is done and the numbers correct themselves, you've been managing to the wrong margin for weeks.
Deliverable-based completion fixes this. Instead of asking "how many hours have we spent," you're asking "what have we actually finished?" Drawings are 50% done, and specifications are 75% complete. These milestones reflect progress you can point to, not just time consumed.
This matters especially in early phases. Research and programming can consume significant hours while representing only a small slice of the actual project completion. And your structural drawings might sit at "90% complete" for weeks while details get resolved. Hours keep logging; the deliverable doesn't move. When your WIP reflects that plateau instead of assuming linear progress, you're seeing the project as it is, not as the hours suggest it should be.
Revenue recognition and billing status
The gap between earned and billed revenue signals cash flow problems before they occur. If you've earned $50K but only billed $30K, you're carrying $20K in unbilled work equity.
This is money you can't use for payroll or new projects. If you've billed $50K but only earned $30K, you're sitting on revenue you'll need to return or work off later. Either gap is a problem you can't manage if you can't see it.
When WIP lives in spreadsheets and invoices reside in QuickBooks, this means manual reconciliation every billing cycle. Export time entries, match to project phases, calculate percentages, verify against contract terms, and resolve discrepancies.
Fusion Design, a 20-person architecture firm, spent 15-20 days each month on this process. Project managers tracked time in one system while accounting prepared invoices in another.
Every billing cycle meant rebuilding the connection between them. When they integrated time tracking with invoice generation, those 15-20 days were reduced to 4 hours. Invoices are populated automatically from time entries. The earned-versus-billed gap was visible in real-time, allowing for the detection of over-billing before invoices were sent out and under-billing while there was still time to take corrective action.
The final piece of cash flow visibility is aged receivables. Your WIP might show a 25% margin, but if $75K of that is sitting in receivables over 60 days, the profit is on paper, not in your bank account. You're funding payroll and consultant bills from other projects while you wait.
Margin indicates whether the project is profitable, while receivables determine whether you can pay payroll.
How to Create a WIP Report in 4 Simple Steps
The difference between WIP reports that require manual reconciliation and WIP reports that update automatically comes down to how you set them up.
Get the structure right from the start: phase setup, cost tracking, completion calculations, revenue recognition, and the data flows themselves. Get it wrong, and you're rebuilding the same spreadsheet every billing cycle.
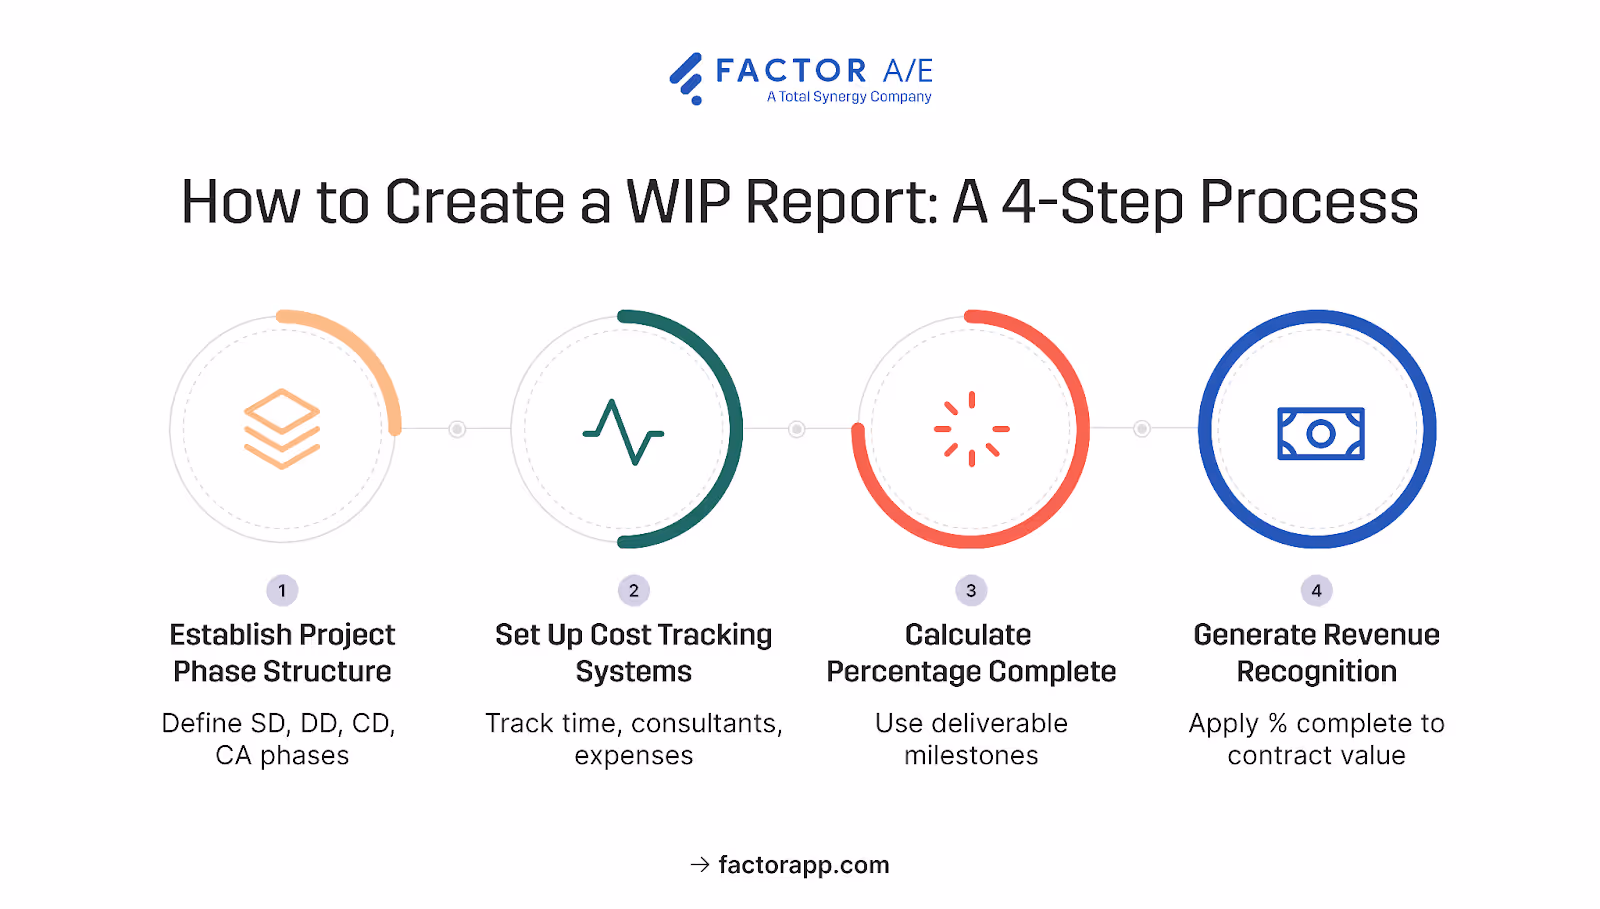
Step 1: Establish project phase structure
Your phase structure determines whether you can see problems at the phase level or only in project totals.
Most firms follow the AIA contract structure, which includes schematic design, design development, construction documents, and construction administration. Each phase gets its own budget based on your historical data, not industry averages. A typical starting point is:
- 15% for SD
- 20% for DD
- 40% for CD
- 25% for CA
But your firm's mix might look different. If you specialize in complex renovations, CD might run higher. If your clients require extensive upfront programming, SD takes a larger share. The percentages matter less than having them defined, so every project starts with the same structure, and you can compare across your portfolio.
Building templates for your core project types (commercial, residential, institutional) means setup takes minutes instead of starting from scratch each time.
Customize WIP reports for stakeholders
Partners need profitability and trend data. PMs need phase-level detail that shows where problems are developing. Your bookkeeper needs the billing status.
When stakeholder views are defined during setup, reports generate automatically. You're not spending the first week of the month building them. You're using them, catching the phase that's trending over while there's still time to course correct.
Step 2: Set up cost tracking systems
If your time tracking only captures total project hours, you won't be able to see which phases are running over. You'll know the project is over budget. You won't know where.
Time tracking by project phase changes this. When hours go to SD, DD, CD, or CA specifically, you see the phase that's burning hours while it's still active, not after the project closes.
Consultant costs need the same treatment. When your structural engineer is 60% through their scope, your system should reflect 60% of their fee, whether or not you've received an invoice. Waiting for invoices means your WIP shows inflated margins that disappear when the bills arrive.
Keep reimbursables separate from direct project costs. They have different markup and cash flow implications, and lumping them together obscures actual margins.
Integrate consultant and expense tracking
Subconsultant management works best when it is integrated with your project hours and expenses, rather than in a separate Excel tracker.
When the consultant progress, invoices, and payments are tracked alongside your own work, you eliminate the reconciliation that creates month-end bottlenecks. You see the full cost picture in real time, not after invoices arrive and surprise accounting.
Step 3: Calculate percentage complete
The setup step that enables deliverable-based tracking is defining what completion looks like before the project begins.
For each phase type, establish benchmarks. What does 25% complete look like for CD? And what about 50%, 75%, 100%? When these are defined upfront, PMs aren't guessing at percentages. They're selecting milestones based on the deliverables that have been finished.
A practical example:
- 25%: Floor plans complete, sections started
- 50%: All drawings in progress, half at CD level of detail
- 75%: Drawings complete, specifications in progress
- 100%: All documents issued
As the scope becomes clearer and complexity is revealed, update your total cost estimates. Initial budgets are precisely that. Your WIP should reflect what you know now, not what you guessed at kickoff.
Automate real-time calculations
Manual spreadsheet updates depend on someone remembering to update them, and they're only as current as the last time someone did.
When your system automatically calculates WIP as time is entered and expenses are recorded, PMs see the current data instantly. They're not waiting for month-end accounting cycles to find out a phase is trending over budget. They're seeing it now, while there's still time to adjust.
Step 4: Generate revenue recognition
Earned revenue is calculated by applying your completion percentages to contract values. If SD is 100% complete on a $15K phase, you've earned $15K regardless of whether you've billed it yet.
Apply the percentage complete to each phase's contract values to determine earned revenue. This calculation shows the revenue you've actually earned from completed work, regardless of billing timing.
Compare earned revenue to billed amounts to identify situations of over-billing and under-billing that impact cash flow planning.
The gap between earned and billed is where cash flow problems hide. This step connects your completion tracking to your invoicing, allowing you to see that gap in real-time.
Additionally, ensure that you adjust for retainage, which affects both cash flow and revenue timing, and factor in any performance bonuses or penalties that alter the final contract value.
Keep WIP where you use it
Your WIP data doesn't need to live in QuickBooks. What needs to flow is invoices out and payments back, so you're not manually updating two systems every time a client makes a payment.
When invoices are generated in your project system, and payments are automatically updated, your WIP remains current without requiring manual reconciliation. The insight lives where you're making project decisions, not buried in accounting software.
Adjust for retainage held by clients, which is common in A&E contracts and affects both cash flow and the timing of revenue recognition. Account for performance bonuses or penalties that may affect the final contract value.
Integrate QuickBooks for seamless reconciliation
Earned revenue is calculated by applying your completion percentages to contract values. If SD is 100% complete on a $15K phase, you've earned $15K regardless of whether you've billed it yet.
The gap between earned and billed is where cash flow problems hide. Factor surfaces this gap automatically, and your completion tracking and invoicing live in the same system, so you see earned versus billed in real time, not after manual reconciliation.
Adjust for retainers, which affect both cash flow and revenue timing. Account for any performance bonuses or penalties that change the final contract value.
Build a WIP That Tells You What is Actually Happening
The point of a WIP report isn't to document what went wrong. It's to show you what's happening while you can still act.
Factor gives you phase-level visibility from day one.
You see margin problems while there's still time to adjust, not three weeks later when the numbers close.
Sign up for a free trial and see how Factor AE automates WIP calculations so you see margin problems while you can still fix them.

Recommended articles


See Factor in action
In one quick call, we’ll show you a simpler way to run projects and get paid faster.
.png)
“I recommend Factor to other firms. The team is great, it’s easy to use, and it has streamlined my project management. It can do the same for yours.”
Adam Mayberry
Architect / Managing Principal
